You are using an out of date browser. It may not display this or other websites correctly.
You should upgrade or use an alternative browser.
You should upgrade or use an alternative browser.
virtuesoft
Member
- Messages
- 94
- Likes
- 2
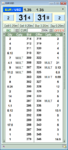
I think that 1 million would be filled pretty easily but it would depend on the broker. If you're with a broker that shows the market depth you will be able to see the current limit orders and you would be able to get an idea of how much would be easily filled.
I've attached the market depth of my broker. It looks like you would get filled fairly easily with 5 million. If you were trading 10 million you may get partial fills spanning a few pipettes.
I've attached the market depth of my broker. It looks like you would get filled fairly easily with 5 million. If you were trading 10 million you may get partial fills spanning a few pipettes.
Attachments
ptsnu
Member
- Messages
- 89
- Likes
- 0
I think that 1 million would be filled pretty easily but it would depend on the broker. If you're with a broker that shows the market depth you will be able to see the current limit orders and you would be able to get an idea of how much would be easily filled.
I've attached the market depth of my broker. It looks like you would get filled fairly easily with 5 million. If you were trading 10 million you may get partial fills spanning a few pipettes.
Thx for sharing pic, are u using Dukas by coincidence?
virtuesoft
Member
- Messages
- 94
- Likes
- 2
Thx for sharing pic, are u using Dukas by coincidence?
No, I use a Currenex broker called London Capital Group. I have a demo account with Dukascopy though. They seem like a good broker. Their JForex platform is really good. The commissions are also pretty good if you use an introducing agent and get the rebates.
Giorrgi
Well-known member
- Messages
- 253
- Likes
- 0
ptsnu
Member
- Messages
- 89
- Likes
- 0
No, I use a Currenex broker called London Capital Group. I have a demo account with Dukascopy though. They seem like a good broker. Their JForex platform is really good. The commissions are also pretty good if you use an introducing agent and get the rebates.
Agreed
Giorrgi
Well-known member
- Messages
- 253
- Likes
- 0
Took an IRB,
I had to change the colour of the bull bars, missed an entry to RB earlier because lil white doji wasnt clear, very annoying.
Prorealtime needs an option to save pics with better quality, faster than taking screenshots and cropping.
Hey,
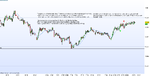
Sorry for replying this late but I wanted to reflect on this trade as I had seen it develop in front of me and didn't think much of it. Here's why.
Even though the chart starts with a strong upswing, the range itself seemed bearish to me. I may be mistaken here so please correct me. To me the range is bearish because, even though the bulls managed to put three equal tops, just before the IRB setup prices were showing lower and lower bottoms. I know that Volman always looks at lower tops and not lower bottoms as a sign of bearish pressure, so this can be where I'm mistaken. Anyone care to comment on this precise point ? Also the triple top is a bearish sign. Therefore I didn't take the trade. The setup itself was of good quality though.
ptsnu
Member
- Messages
- 89
- Likes
- 0
Hey np,
Thx for ur input.
I just woke up, needed some rest from session.
Yes, this is a tricky chart. More than 2 patterns and miniWs inside the range.
U are right about the general pressure, but something that I gave to the bulls was the mini W that got formed right b4 the setup, I tho of it as a SB inside the range, I dont want to create confusion here, just saying that to me after that miniW, I was thinking of trying to find a way to go long.
Now, this IRB is not the kind that sits on the middle of the range where the pressure is 55 45% or 60 40% (lil of doubt) and waits for a signal to break either side. I maybe need to restudy, but I think this one is the kind that after the obvious doesnt happen, then the odd attacks, and here the odd (because of slightly bigger pressure to the downside) would be going up. Maybe someone else has a comment on this?
Let me take a look at the charts u posted, cause I was sleeping so couldnt check them b4.
Hey,
Sorry for replying this late but I wanted to reflect on this trade as I had seen it develop in front of me and didn't think much of it. Here's why.
Even though the chart starts with a strong upswing, the range itself seemed bearish to me. I may be mistaken here so please correct me. To me the range is bearish because, even though the bulls managed to put three equal tops, just before the IRB setup prices were showing lower and lower bottoms. I know that Volman always looks at lower tops and not lower bottoms as a sign of bearish pressure, so this can be where I'm mistaken. Anyone care to comment on this precise point ? Also the triple top is a bearish sign. Therefore I didn't take the trade. The setup itself was of good quality though.
Last edited:
ptsnu
Member
- Messages
- 89
- Likes
- 0
I only traded from 10 to 14 London time (woke up late and had to leave for class).
I would like to know if my exit point was correct on the second setup.
@Virtuesoft, thanks for clearing that up for me !
Pic1 It would be a crime not trading that IRB 😆. Pressure up was everywhere, tho the way that last bar (entry bar) is the kind that make me order my hand to trade, instead of doing it 100% calm, is still valid.
Pic2. I cant comment there,sorry. I havent reached tipping point tech chapter, Im currently starting ARB.
ptsnu
Member
- Messages
- 89
- Likes
- 0
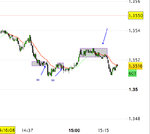
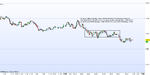
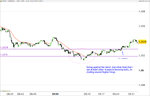
A trade I just took. This one went south. Any comments appreciated.
I took this one. Take a big look at the whole range, is a big inverted S-H-S where our setup represents the break of the right shoulder. Ns opportunity IMHO.
Giorrgi
Well-known member
- Messages
- 253
- Likes
- 0
I took this one. Take a big look at the whole range, is a big inverted S-H-S where our setup represents the break of the right shoulder. Ns opportunity IMHO.
Yeah I didn't identify the inverted head and shoulders (if that's what you mean by S-H-S). But I think I got unlucky with prices going so low at that point. I haven't reread the tipping point chapter yet but I think this was a proper sign to exit.
See you tomorrow for more trading adventures. You're learning very fast! It's a shame all the old posters except BLS and Virtuesoft left the thread.
ptsnu
Member
- Messages
- 89
- Likes
- 0
Yeah I didn't identify the inverted head and shoulders (if that's what you mean by S-H-S). But I think I got unlucky with prices going so low at that point. I haven't reread the tipping point chapter yet but I think this was a proper sign to exit.
See you tomorrow for more trading adventures. You're learning very fast! It's a shame all the old posters except BLS and Virtuesoft left the thread.
Thx 😀
See u tomorrow 👍
matty_dunn
Active member
- Messages
- 188
- Likes
- 17
Thx 😀
See u tomorrow 👍
Hey guys,
I just wanted to thank you all for your posts. I read all of them when I have the time. Sorry for not posting much - very time poor. Also, I'm sleeping or at work when most of the posting is done.
Anyway, just wanted to say thanks. Appreciate it!
Giorrgi
Well-known member
- Messages
- 253
- Likes
- 0
ptsnu
Member
- Messages
- 89
- Likes
- 0
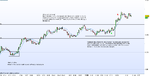
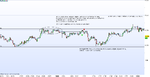
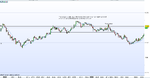
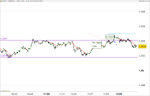
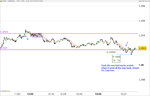
Confusing morning. Took one trade, which revealed itself to be against the dominating pressure. The rest of the charts are simply for show. I'm very interested in how you guys handled it this morning.
Similar here, 1 trade loss, 1 small scratch. Let me check ur charts
ptsnu
Member
- Messages
- 89
- Likes
- 0
Confusing morning. Took one trade, which revealed itself to be against the dominating pressure. The rest of the charts are simply for show. I'm very interested in how you guys handled it this morning.
Pic 1. It happened exactly the same thing to me, that was prob the best trade so far, and I let it pass.
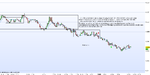
Pic2. What u have on elipsis, was what I deemed a range, but the pressure b4 wasnt the best and the setup was ok, that costed me some pips.
Pic3. I took that one, had to scratch, only to realize it hit target, but much later, Havent read tipping point, but based on the way it came all the way back after going down 7 pips, I think I did ok closing it.
ptsnu
Member
- Messages
- 89
- Likes
- 0
Im posting what I saw or took today. I have noticed that when both parties fight their corner with strength, targets either tend to not be reached or to be reached on a different fashion. Or like Giorrgi says, confusing, not easy to asses a remarkable superiority on pressure. Days like today prob need much more practice, to not force trades. The problem is how to differentiate a market not showing good overall pressure, from a market showing it very subtetly? Lots of XP and screen time I guess.
Attachments
ptsnu
Member
- Messages
- 89
- Likes
- 0
Np, yw, feel free to share any thought even if its about a chart from day b4.Hey guys,
I just wanted to thank you all for your posts. I read all of them when I have the time. Sorry for not posting much - very time poor. Also, I'm sleeping or at work when most of the posting is done.
Anyway, just wanted to say thanks. Appreciate it!
Similar threads
- Replies
- 15
- Views
- 8K