samich1262
Well-known member
- Messages
- 293
- Likes
- 3

Here it is. Don't know what's wrong with the attachments lately!

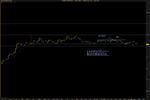
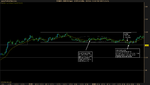
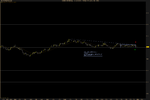
Noooo I missed the re-entry... left the computer for a few min, didn't see this in time. This may actually be a better entry than the original. I'm new to these diagonal IRB's. This doesn't look too aggressive to me, this type of IRB is just a little unfamiliar. There's obvious buying interest at the 40 and price compresses quite a bit. Dojis resting on the average... I dunno. Let me know what you think...
View attachment 147474
I'm finding it scary to trade BBs/IRBs where the entry bar dips below the EMA, to me it looks like insufficient buildup.
@samich1262
I wouldn't entry that even if I had a second chance, but it's just my opinion
Why not? Just curious.
I think the results make the setup seem better then it was. The angular line is basically the only thing that makes it look tradable.


I don't know if that should scare you off. Figure 12.2 in the book is like that. 12.1 even just barely conquers the average before breaking. Fundamentally, this IRB looks ok and I think it has a decent amount of tension. 2 higher lows, 3 dojis before the break, price using the EMA as support. I dunno, personal preference I guess, but I think this box has enough tension for me.
I remember somewhere in the book (maybe in the RB chapter or unfavorable condition chapter) Bob mentioned the size of the W/M pattern (relative to PA) matters, just cannot find it from my notes.
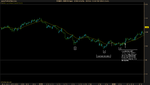
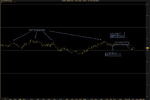
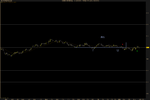
Well I've seen better days, but it's a lesson nevertheless.
Noooo I missed the re-entry... left the computer for a few min, didn't see this in time. This may actually be a better entry than the original. I'm new to these diagonal IRB's. This doesn't look too aggressive to me, this type of IRB is just a little unfamiliar. There's obvious buying interest at the 40 and price compresses quite a bit. Dojis resting on the average... I dunno. Let me know what you think...
View attachment 147474
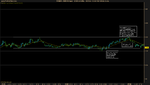
Yeah, it was tough, and I think the European session may have been hijacked by higher time frame traders or something. There are some moves but they didn't build properly first.
No trades for me today but I'll post my take on today's session.
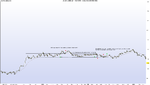
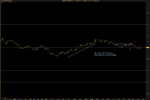
Will appreciate any thoughts on this chart.
I think it was wise to wait for the break of the bigger box. You have a vacuum effect below, but you are also shorting into 50% retracement of previous bullish move, so there's no need to be hasty about it.