This is the new updated weak list ,, Please ignore RIMM and AAPL on the third column ,
Grey1
all weak, no strong?
Glen
This is the new updated weak list ,, Please ignore RIMM and AAPL on the third column ,
Grey1
This is the new updated weak list ,, Please ignore RIMM and AAPL on the third column ,
Grey1
Hiweak market tonight down 1.8%;
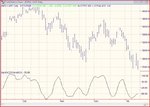
The birth off a trend north?? (or at least a few days of a technicial bounce?)_ MACCI day O/S
View attachment 32452
strong list
View attachment 32455
weak list
View attachment 32453
Hi
My daily MACCI reading of indu at close was -78. I guess tha one of us is getting an incorrect reading!
Maybe someone else could share their reading?
Steve
Hi Steve-mine shows -80.785. If I remember correctly, G1 had said ( & I feel the same)that it is not absolutely necesssary for the turn to take place at any specific value..so lets see what happens on Monday....
Raj
Steve/Raj,
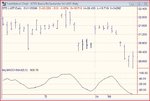
For the record I am enclosing a copy of my TS8 chart. Mine says -77.64!
Cheers,
Imran
Steve/Raj,
For the record I am enclosing a copy of my TS8 chart. Mine says -77.64!
Cheers,
Imran
Could some kind soul help me out in pinning down the MACCI? I don't use Tradestation but my guess from looking at the indicator legend in Imran's post that it's referring to a 5 period adaptive/exponential ma of the 6 period CCI. From my trawls through the TT threads I believed that sometime ago the question was asked as to the "correct" parameter values to use - 20,6 or 6,5 and I thought the answer came back 20,6 but I may have been mistaken and would have to start the search again in order to confirm. When communicating with Iraj I also thought that 20,6 got his blessing. Now confusion returns to my already fuddled brain. Either way, my calculated values differ significantly from the two values posted previously - but I can tackle that problem later!
Any views would be much appreciated.
Al
moreagr, I'm sorry I havent started using the radarscreen with Iraj's stuff and I dont use the global variable dll so cant help you on that. However I had a quick search and came up with the following topics on the TS site:
https://www.tradestation.com/Discussions/Topic.aspx?Topic_ID=4235
https://www.tradestation.com/discussions/Topic.aspx?TOPIC_ID=16825
(the second link is specific to V2)
Regards,
Imran
Paul,
Thanks for the clarification - nice to be sure I'm in tune with everybody else.
Moreagr,
I use Neoticker but nevertheless the offer is appreciated - thanks. It should be fairly simple to sort out but I need to look again as to why I'm getting a different result even with the 6,5 setting.
Probably best if I move to a new thread if I have to pursue this as I don't want to deflect from the main thrust of this thread.
Al
Al, The MACCI may produce a slightly different result from whatever you depending on what type of MA has been used in the MACCI to do the smoothing on the CCI. Try different MA's on your Neoticker.
Regards,
Imran
Yes, Imran, I know there are quite a number of different versions of the ema and also that the stabilisation of the ema depends on the number of data points that are included in the series. I feel that my values are too far away from the examples posted earlier for either of these possibilities to be the cause but I'll have to look into it tomorrow to be certain.
Thanks for the suggestion.
Al


Sorry just saw this post.. MACCI daily WAS heading up on THURSDAY but now is flattening which basically means bears are still in control. It is very bearish if MACCI flattens and heads down from OS levels. IN another word even TECHNICAL catalysts are not stong enough to take the market up.. I am bear LONG term and feel traders MUST BE SHORT of stocks in their swing portfolio SELL IN TO ANY RALLIES ....ok, havn't have an answer from G1 on the other thread yet about going long, in this, as he see it, a bear market,
so i'll plod on,
the daily chart INDU look like its cycleing north, has been O/S
View attachment 32498
attached is charts of stocks from the strong list that O/S ish on the MACCI day charts (on a simlar cycle to the INDU)
View attachment 32492
View attachment 32493
View attachment 32494
View attachment 32495
View attachment 32496
will be looking for strength in these stocks tomorrow, then open longs at around close, and leave open till Wed if target not hit
