counter_violent
Legendary member
- Messages
- 12,672
- Likes
- 3,787
Scenario 2 and 4 (yours) has gone.....just leaves 1 (the highest probability and always was )and scenario 3....which one now Joe ?
G/L
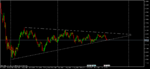
Ffffffin meta...you draw a trendline on weekly then switch TF to daily and the line appears in a different place 🙄 😆