anyone trading cable 2013 - lets roll

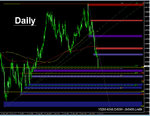
I was in it on the monday way before the figures on friday, I just didn't interfere with the trade afterwards. It was the low on November 15th last year, support line on daily timeframe.
 
nice little reaction off those bids, not that I trade bids reported I only use them for confluence with other factors.
 
if the 75's pop next stop is 50s, I dont have any reported techs until the 50s.
 
extended pullback off those 75 bids. a deeper pullback would take us to 1.57 where we have previous support becomes resistance a 38.2 fibo plus it's a round number.
 
leaving office now, will hold my trade and review stop based on daily close, all good @+90pips
 
having reviewed the charts I am moving the stop on my short position to 1.5721, if price does retrace this far and stops me out I will net +50.5 which I am fine with. We have some bullish candle formations on the H1 and we could see a deeper retrace here however 1.57 is still proving difficult to reach. In between 1.57 and my stop @ 1.5721 we have 2 levels which are previous support & resistance on the H1 both have fib clusters x 2 at each level, I would be disappointed if both of these don't hold. The daily candle is a bear thrust so I continue to hold overnight my short with a target of 1.55.
 
Another strongly bearish daily candle close (9 out of the last 12 [not incl sundays] have closed with a bearish body.) 5672 the low Monday - in the region of Weekly S2 (5665 on my feed) and a 3 fib cluster 5692-69 with price nearest 61.8% of the main 5263-6349 (5679) at that low....small vounce from there with price exceeding the 20 day atr at the low point-Monday's low. We are alre4ady below Monthly S3 and price is at 124% of the 20 month atr now with just 3 more trading days of the month left. Below Monday's low the last and lowest of that 3 fib cluster @ 5669 = 76.4% 5456-6349. Weekly S3 @/around 5585 falls close to 85.4% of same 5456-6349 and both these fall in a previous minor daily swing lo zone.

Daily remains in a general downtrend with 4 x LL's and 1 x LH now.

Daily chart below

G/L on that short CM !
 

Attachments

  • dly.jpg
    dly.jpg
    207.6 KB · Views: 114
Cable trading with a bullish tone this morning it feels, with so many down days this market is very over sold, could see this retrace to 1.5793 over the coming days , I have gone long at 02 stop below yesterday's low, initial target 45
 
Cable trading with a bullish tone this morning it feels, with so many down days this market is very over sold, could see this retrace to 1.5793 over the coming days , I have gone long at 02 stop below yesterday's low, initial target 45

Yeah looks like I could get stopped out on my short soon.
 
Bullish follow thru/pullback off yesterday's 5673 lo finds supply at 23.6% 5890-5673.....offers touted 5720-30 earlier also 5740/50 ?

G/L
 

Attachments

  • z.jpg
    z.jpg
    135.6 KB · Views: 106
CABLE: MNI Cable: Fundamental levels (orders, options, technicals),
$1.5892 Weds Jan23 high/$1.5900 200-dma
$1.5870/80 Medium offers
$1.5850/55 Strong offers/$1.5860 Stops
$1.5830 Strong Offers on approach
$1.5827 Fri Jan 25 high, recovery off $1.5745 GDP react lows
$1.5795/800 Medium offers
$1.5745 Medium offers/Stops on break
$1.5743 Recovery high in NY off $1.5674
$1.5727 Int.Day high Europe, Asia $1.5708/76.4% $1.5743-1.5674
$1.5720 **Current market rate 1040GMT Tuesday
$1.5686 Int.Day low Asia
$1.5675/70 Strong demand/$1.5674 Mon Jan28 low
$1.5650/35 Medium demand
$1.5616 Tech; trend line support
$1.5610/00 Medium demand
 
Where are the sellers ? - I bet a lot are asking that -wanting to get in short again with the 4hr/daily downtrends.....new daily hi on that last run up which followed a classic congestion 2nd b/o play of that horrible little mid morning range that followed the 1st pullback off that 23.6% fib and touted offers area. Bullish intraday so far though.

G/L
 

Attachments

  • z.jpg
    z.jpg
    73.1 KB · Views: 118
Top