Anyone scalping the FTSE Futures??

i have been looking into (a few searches on google) the Ted spread, 3month US bills versus LIBOR, i have read this is the most widely traded spread.

also requires very little margin
 
The temptation to trade what you think and not what you see is always very strong. Especially when the market is grinding up slowly and making new highs in areas it hasn't been for a while. This morning's price action has been very slow. On the daily the ES made a clear bounce off support at 1446, and should try to go above last fridays high of 1463. It has come close at 1461 this morning, but it has struggled to get closer than that. If it goes below 1454.75 I have to believe that we will see a bigger move down, taking the FTSE with it. The FTSE futs need to go below 6020.5 to signal a bigger move lower. Personally, I still think we will keep grinding higher. We are at the start of results season, and we have the big US banks reporting next wednesday, which should trigger the next big move. All of this mornings price action has been contained in 15.5 pts, which makes for a tight range to make any decent trades. Looks like it is trying to test the low at 8am, maybe a bounce off 6053-ish.
 
US10yr yield up strongly, money leaving safety

That should mean that equities will benefit from new money. On the daily ES chart, it sure looks like we will breakout to new highs. Maybe the gap won't get filled, which it seems is what everyone wants. Gap and go.
 
Last edited:
That should mean that equities will benefit from new money. On the daily ES chart, it sure like we will breakout to new highs. Maybe the gap won't get filled, which it seems is what everyone wants. Gap and go.

Agree everyone looking for the gap, including myself, but i think your right, this market will suck in a few more longs and push some stops before it does !
 
That should mean that equities will benefit from new money. On the daily ES chart, it sure looks like we will breakout to new highs. Maybe the gap won't get filled, which it seems is what everyone wants. Gap and go.

Hi MartinC-J if bearish on FTSE check out BP 9 month chart, looks like BP broke 453 resistance might come back and retest, but if it has broken out then we would need it to reverse, also its sister RDSA is having a good test of 200ma, wants higher.

HSBA worth a look also,
 
FTSE high 6114 with a range of 17pts , we can do 30pt range so 6130 should be possible today.

EURUSD/US10yr supporting move higher in risk assets
 
is it me or does draghi look like dracula?

Depends if you are short or long :)

Everytime he talks this happens. Back on July, when I was not aware of the phenomenon and short big time, I remember didn't had enough time to reach my computer to close the shorts :LOL:

Pity I didn't play long EUR today. It was expected.
 
Dunno why you guys are so keen on risking getting your feet wet when the tides still coming in :).

Remember those reported truck loads of money that were waiting to hit the market when the fiscal cliff was sorted. Whilst there's a net inflow of money the thing will continue to rise despite all the attempts to take it down which have failed so far.

Sure, the tide will turn at some time and there'll be plenty of time to start paddling when it does. In the meantime enjoy the flooded fields :)
 
yep every time he speaks we get this ! Not looking good for my short DAX posi ! hey ho its still early ! Tried a small short eurusd ahead of ECB 30 tick stop ! straight in straight out ! Cheers Mario ! (n)
 
Hi MartinC-J if bearish on FTSE check out BP 9 month chart, looks like BP broke 453 resistance might come back and retest, but if it has broken out then we would need it to reverse, also its sister RDSA is having a good test of 200ma, wants higher.

HSBA worth a look also,

It does look like BP. has broken out and if it continues should test 500p. Same goes for crude. Heading towards $100 again. I just don't see indices/stocks reversing and going down for a while. Mostly sideways to up until earnings season is out of the way and it can test support then.

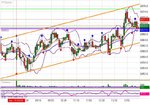
We have a very clearly defined channel on the 5 min chart for the FTSE futures.
 

Attachments

  • channell on 5 min 10 Jan 2013.jpg
    channell on 5 min 10 Jan 2013.jpg
    106.9 KB · Views: 161
yep every time he speaks we get this ! Not looking good for my short DAX posi ! hey ho its still early ! Tried a small short eurusd ahead of ECB 30 tick stop ! straight in straight out ! Cheers Mario ! (n)
I do not usually trade EURUSD but with pivots it gave a buy signal once it traded at 1.3085
 
It does look like BP. has broken out and if it continues should test 500p. Same goes for crude. Heading towards $100 again. I just don't see indices/stocks reversing and going down for a while. Mostly sideways to up until earnings season is out of the way and it can test support then.

We have a very clearly defined channel on the 5 min chart for the FTSE futures.

nice chart, what is the wavey bollinger type line on your chart?
 
Top