SuddenDeath
Legendary member
- Messages
- 14,063
- Likes
- 143
anyone know where i can get fair value for SP500 futures, (es`u)
Morning Bustech
This thread is where we call tops in the market, surprised we only have 67 viewers. 5933 called by et.
and 5876 august 2012 high called by me, where else can u get that kind of service.
Morning Bustech
This thread is where we call tops in the market, surprised we only have 67 viewers. 5933 called by et.
and 5876 august 2012 high called by me, where else can u get that kind of service.
a bottom'd be nice at the moment 😆
A decline to the 21 day EMA and then I bounce methinks
Good call eh?
what level u have the the daily 21 ema?
chart

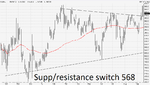
I've redrawn my 4hr bullish channel so that we are now on a bullish channel line from 13/9/12. You might think we'd get a kick here because it's also the lower edge of the bearish channel. The pullback from last range is 50% though, which is a bit odd. If we pulled-back from here there would be no support in the candle action, as directly across in the upmove is a large bullish candle. I'd be very uneasy if it tried to make a significant upmove from here, as I would be worried about a spike down to 61%, where the real S/R is (I think), as you can draw a horizontal line roughly separating August lows from September highs here: resistance >> support.
I'd be more happy to call end of pullback if we got to 5820.
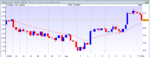
I think the next target is 6221. I don't have chart history to check that number is at a S/R level in the price action. I did download the incrediblecharts thing over the weekend (thanks to Dick Lexic) so I might have another look at that later. I'm also getting the 6221 target by what I think the 2 week chart should look like. Above 4hr charts it's harder because I have got fewer timeframes.
Beautiful surge down across the Indices.......Closed and out on Cac Ftse and Dax
Just received the Following from FTSE Trader which some may not have seen............
Vix October Calls | FTSE Day Trader - Day Trading the FTSE 100
if we find out whats trending on google twitter and put those terms in he we could get to 500+ viewers
few days off .... see you guys next week
Just received the Following from FTSE Trader which some may not have seen............
Vix October Calls | FTSE Day Trader - Day Trading the FTSE 100
You would get far more viewers if you offered a grail or two, or some magic indicators or signal service, anything that requires no effort and instant riches.
Unfortunately, you guys show what trading is really like; study, decision making, risk assessment, waiting. Steady build up of funds and understanding of ones' psychological make up.