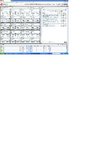
All out of Ftse 100 Long Dec contracts since 24th August.
Build of positions started on this date and was pushed (averaged in/up).
Attached is a screenshot for clarity.
For those of a sceptical nature or those who find it difficult to trade or are particularly having a hard time I make this statement:
I am not a Vendor nor wish to become one.
I do not give out trading advice nor wish to debate my opinions (they are mine and mine alone)
I have nothing to prove like the rest of us on here.
This has been posted as a confidence boost to those that may need to re-believe that trading and being profitable really is possible, all others that are constantly withdrawing money and are net profitable already know this.
I have purposely posted this here as this thread in particular is a very clean one with decent honest people and one in which I enjoy following (and is the only thread I may add). I pay no minds to trolls and I have better things to do than photoshop or hang around all day swinging my d1ck.
Have a great weekend all, its here at last.
Regards,
Lee Shepherd
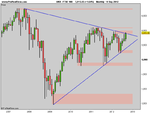
PS: I am looking for Dax shorts around 7k area or 7500 whichever come sooner however I reserve the right to change my mind at any time depending on market sentiment, technicals and fundamentals. Will post when this arrives and have entered, again with a screenshot attached.
A big shout out to Bustech & Sudden Death in particular who these 2 people I have noted seem to be doing very well, I'm a great follower of you both and your great posts.