Anyone scalping the FTSE Futures??

its wierd that FTSE gives the close for likely direction of dow/sp500 if u watch it 15mins before the US opens
 
i have just downloaded a little app that makes your windows transparent (xp)

maybe you could just place one chart over the other? ...just a thought

i haven't tried it out yet so no idea if it works

Crystal XP Download - Softpedia

Shame it's XP, you know if this works on 7?

Having said that as I'm with IG I'm just going to use their Advanced charts. Never even looked at getting them before as there's never been any reason to as I just use S/R and PA but now it's probably worth while getting them.
 
Shame it's XP, you know if this works on 7?

Having said that as I'm with IG I'm just going to use their Advanced charts. Never even looked at getting them before as there's never been any reason to as I just use S/R and PA but now it's probably worth while getting them.

soloquan did u check out investors intelligence website i know they used to have ratio charts.

also stockscharts do a "perf" chart u can combine two tickers into ratio
 
Shame it's XP, you know if this works on 7?

Having said that as I'm with IG I'm just going to use their Advanced charts. Never even looked at getting them before as there's never been any reason to as I just use S/R and PA but now it's probably worth while getting them.

i dont have win7 but i think its built in....you need to do a search
 
:LOL:

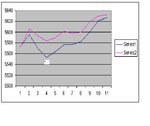
I missed that post but thanks for pointing it out. What I was thinking was... if at say 8am every morning if I draw two lines where the current price is (one for ftse one for dow), work out the difference between the two and then if that gap widens/shortens that is an indication of weaker/stronger trading?

On this chart with the two prices, the dow doesn't have it's actual price it uses the axis from the ftse, so I can use that scale to work out the difference.

Or is that what you were getting at anyway?

solo

I think reksa pointed out the ig things way back in the thread - I think when I looked it I was more happy with numbers. Be interested to know what you think.

The sort of thing I had in mind for what I want is about how I knocked up a small excel thing (thumbnail). FTSE is blue line and pink line is FTSE as calculated by reference to DOW.

The common starting point is last Thursdays close - so real FTSE = 5573 and calculated FTSE = 5573 at that point. From there it runs through to Friday's FTSE close and you see the "extreme" gap reached at A after which the gap was gradually closed, but not completely.

If we can get something like that which shows it in continuous real time (the thumbnail is based on hourly closes) we'd be quids in :) - but getting the common starting point is crucial. There are some combo charts that always start from a common point wherever the left hand edge of the chart is - that would be ideal.
 

Attachments

  • ftsegap.JPG
    ftsegap.JPG
    37 KB · Views: 120
Employing Protective Stops to Manage Your Trades
by Jim Wyckoff

Synergistic Trading

Before I discuss the advantages of using protective stops, I want to discuss a disadvantage about which many long-time traders are fully aware: Floor traders in the pits "gunning" for stops. This is a real phenomenon whereby "local" floor traders (those who trade for their own account) think they know where most of the resting buy or sell stops are located, and then attempt to push prices into those stops, set them off, and then let the corresponding price move run its course, only to then take profits on that move and the market price then returns to near levels seen before traders went gunning for the stops. This action by floor traders is not illegal or even unethical--it's just a part of futures trading. These floor traders have to pay a lot of money (or their sponsor pays their fees) to trade in the trading pits on the exchange floor. They do have some advantages over off-floor traders and, importantly, they also provide the needed market liquidity that all traders and hedgers appreciate.

Floor traders gunning for stops is more an art than science, as market conditions have to be just right for their efforts to pay off. For "local" floor traders to push a market in their desired direction, outside fundamental factors need to be about in equilibrium and not having an influence on market prices. For example, any floor traders gunning for sell stops just under the current market price won't get the job done if there were a bullish fundamental development that would pushes prices higher. Remember, no one group of traders--not even floor traders--can influence market prices very much or for very long...................
 
IMHO he is an idiot.. ...has been wrong so many times....if it was real account he would have been bankrupt by now

i hate the twitterattis to the core....they are just fooling the gullibles to buy their useless services

messers pboyle and company should attack twitter.....t2w is drop in ocean compared to the mass fraud on twitter

i am not sure i remember Kass being wrong, ?
 
Top