Advanced Structured Forex Trading

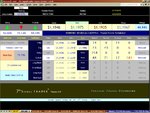
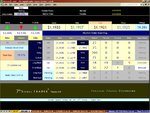
Feb 19-20 Dashboard at 1:07am east, 10:07pm pac:

I'll be getting back to your questions as soon as I take care of some personal business on Monday. Here is the Sun-Mon Panel pick to compare to your own pivots and entry points. Thanks. 😎

(Note: This is the way the Pane looked at the time of this post. The Initial Move was already over by the time I got to run the update for this session - however, the Primary Move seems to be just starting up according to the Panel).
 

Attachments

  • Feb 19 through 20.jpg
    Feb 19 through 20.jpg
    285.4 KB · Views: 309
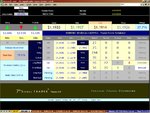
Bug Fix

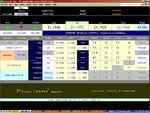
Minor bug found in Panel. Advanced Blade/Apex trade (the very thing I wanted to see all last week) profiles in Panel had an incorrect variable that turned off their Trade status light, not allowing the profiles to become active. Now fixed in 6.0.

I'm going to leave both on the board and let this bug fix not serve its purpose - rather than delete the first Feb 19-20 Panel. I've also not decided yet whether or not I will force the Initial Move and Day Trade profiles into the "Off" condition on the Blade/Apex event. I'll make that determination after the Beta/Certification of these new profiles.

So, for right now, I'll leave both the basic trade profiles (Initial Move and Day Trade) along with the advanced trade profiles (Blades and Apex) in the "On" position. In Production mode trading (real cash/real accounts), I will one or the other for any given session.

(See pic below)
 

Attachments

  • Feb 19 through 20.jpg
    Feb 19 through 20.jpg
    300.3 KB · Views: 309
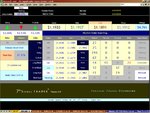
Bug Fix

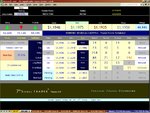
In the Advanced Trades Profiles, the Short Apex Trade had an error in the Stop calculation Fixed in 6.0. No impact/effect on this Panel as the highest high at the time of this post was $1.1975, with the Short Apex Entry at $1.1996 and the "Stop" at $1.2021.

I'll leave this 3rd Panel for Feb 19-20 as a point of comparison to the 1st and 2nd Panel posted this session.

I'll be back to Q&A after I take care of some personal business through Monday. These things caught my eye before I could shut down for the night, so I might as well take care of them as they are very easy minor bug fixes.
 

Attachments

  • Feb 19 through 20.jpg
    Feb 19 through 20.jpg
    299.2 KB · Views: 351
Here are the levels for today, set at midnight Eastern time for EUR/USD:

Traditional levels:
Resistance: 1.2009 and 1.1990
Pivot: 1.1956
Support: 1.1937 and 1.1903

Custom levels
Resistance: 1.1998
Support: 1.1921

Predicted:
High: 1.1967
Low: 1.1858
 
Feb 20-21 Dashboard at 7:06pm east, 4:06pm pac, 0006GMT

(Notes and Q&A to follow...)
 

Attachments

  • Feb 20 to 21.jpg
    Feb 20 to 21.jpg
    293.2 KB · Views: 376
Ok - back to business.

Took in 44 pips on the Initial Move and Day Trade from the last session just expired - a nice little start to a new week. Now in Advanced Trade status using Long and Short Blades to either Apex Entry point. This is what I've been waiting to see for a solid week, so I'm happy to be able to finally get on with this portion of the Beta run.

The concept is fairly simple and very often misunderstood by many Forex traders especially. I come from an Equity Options background (Iron Butterflies, Call/Put Back Spread Ratios, etc., etc., etc.) where non-directional trading is really the only way (outside of having insider information) to trade stock options with any real long term success. So, I’ve been searching for a very long time to implement some similar principles of non-directional trading into my Forex business.

Non-Direction Trade: simply means that I don’t have to know which direction the trade will progress into. All I need to be fairly confident about is that a channel exists within the time-frame of my entry/exit execution. Here, in the Forex, I don’t have concerns about profit eroding concepts such as Theta, nor do I have to worry about the arbitrary elements of market Gamma. All I need to understand is that a “market range” (or, channel) exists sufficient to encapsulate both my Entry and Exit into a position. The rest is all a regression back to the mean of the channel after an Apex, or a strike on the upper or lower band of the channel has been made.

I use the term “Blade” and two trades both long and short at the Open of the session because I don’t care about “direction” so much as I do the Magnitude of the movement for this session. So, “Blade” refers to the “cutting action” up to or down to either Apex by both trades. So, in my mind, they “cut” down or up to the Apex. These blades have two edges – much like a two edge sword.

An Apex can either be positive, where the close price moves to its high for the day above the Open, or negative where the close price moves to its low for the day below the Open. When the close price enters either Apex (negative or positive), I the Dashboard Panel will show the Trade status for the “in-the-money” Blade as “Cut”, which means that it is time to “closed” the “in-the-money” (so to speak) Blade and allow the “out-the-money” (so to speak) Blade go recursive back towards the mean of the channel – or, I call it: The Returning Blade. The returning blade should come at least back to the Open plus/minus the cost of the transaction, in this case – the spread cost for the OTM returning blade (or, what I affectionately call, Blade Costs).

So, where is the money made?

Good question. The money is made based on three (3) short-term market dynamics:

1) An incursion into the Long or Short Apex Entry
2) Maintenance of the Channel
3) The recursive quality of the OTM Blade

Without getting into the technical system related details, which is far more detailed and fairly complex, there must be enough/sufficient Magnitude in the pair to move the close price to through the ITM Blade (either Long or Short Blade) Limit plus one pip to trigger one of the Apex trades without triggering the Apex trade Stop. This brings into play the significance of the system’s ability to intelligently call the channel. My trading requirements are 24-48 hours in nature – I like to be in and out of the market within that time frame, so the system does not have to call a channel that lasts forever, just long enough to contain the Blade and Apex trades. So, the channel must be maintained at least long enough to allow for as much recursive-ness of the Returning Blade as possible.

At the same time as the Returning Blade breaks-even (the OTM Blade), the Long or Short Apex trade should be moving into a positive net profit position very shortly after the ITM Blade has been “Cut” loose from the equation. Both the Returning Blade trade (OTM) and the Apex trade, work in synergy to generate a higher net profit on the session while reducing the risk of the OTM Blade at the same time.

So, to review:

When the Dashboard Panel shows the Advanced Trades active (“On”), then at the Open, the Long and Short Blades are entered at the prices shown on the Panel (or, close to it) with their associated Limit Orders and no Stop Orders. For the first leg of the trade, the carry loss will always be equal to the ITM Blade pip “Capture”, minus the OTM Blade pip “Capture” shown on the Panel. This will be determined by the average pip spread for each Blade. As the ITM Blade strikes its Limit, its trade status light turns to “Cut” – that trades then gets closed in a net positive pip condition and the associated Apex trade gets triggered one pip above/below the ITM Limit Order. If the system has identified and structured the channel correctly, the OTM Blade becomes the Returning Blade and makes its run to Break-Even while the triggered Apex trade attempts avoids its Stop Order and makes a run to the channel mean.

Once the Returning Blade trade and the Apex trade approach the channel mean, the Apex trade should strike its Limit Order and bring the Returning Blade into a small net loss condition, break-even condition, or small net loss condition which should be more than canceled out by the net profits of both the ITM Blade trade and the Apex trade.

So, clearly, the short-term market dynamics listed above must be held in check in order for this to work out.

Maximum risk exposure comes when there is a sustained channel break-out. The ITM Blade will compensate for some of the loss up to the point where the ITM Blade gets “cut”. At that point, the trade is near break-even. However, upon a continuation of the move through the channel (a break-out) to a sustained new high or low, the OTM Blade trade AND the Apex trade will be in a net loss condition. The Apex trade will finally hit its Stop Order and the OTM blade would continue on for additional losses on the trade profile.

Extreme care must be taken to understand when a channel is being formed and when it will hold (minus any unforeseen news event). Terminating the OTM Blade trade upon failure of the Apex trade to avoid its Stop Order, becomes critical assignment number two for the trader in the case of a channel break-out.

A full understanding of channel dynamics should be had by any trader attempting these types of trades. These trades are literally two edge swords. They can be some of the easiest money in the market, or they can be some of the costliest trades ever made. Thus, one should be fully aware of the dynamics of the channel before attempting such trades.

This is NOT the same as waiting for the price to move into the Apex region and THEN entering a trade in the opposite direction. This is highly misunderstood by many. The ITM Blade would never exist if that were done and thus the risk/reward ratio would be significantly higher by not having the ITM Blade. The ITM Blade trade PLUS the Apex trade are what drives down the risk/reward ratio as long as the channel is maintained. So, there is additional risk being added to the equation due to the possibility of a channel break. However, this is why I use a system to help me understand the nature, behavior and dynamics of the channel when it does exist and help me avoid these types of trades when the channel has a small probability for being maintained.

This is a bit more advanced than last weeks naked, single sided, directional trades, but it is exactly why I am here and why this portion of the Beta exists.
 
Other System Changes:

Made an adjustment to the Outlook Trade probability output. It now points to a different output source for the dynamic number seen on the Panel under the Outlook Trade's signal (the arrow). The magnitude of the probability is below 65% and thus the Outlook Trade status light is in the "Off" condition.

I'm going to be keeping an eye on this in order to make the determination of which probability calculation to use long-term. Yet, another component of the system being dialed-in before I return to Production level trading.
 
Punch said:
Here are the traditional and custom levels for today. These levels are set at midnight Eastern time. For EUR/USD:

Traditional levels:
Resistance: 1.1948 and 1.1917
Pivot point: 1.1883
Support: 1.1852 and 1.1818

Custom levels
Resistance: 1.1918
Support: 1.1847

Predicted:
High: 1.1918
Low: 1.1821

As you can see we have a lot of potential resistance around 1.1918.


Thanks for posting these, Punch. 🙂

It looks like this is where the system finally parted company with conventional TA. I thought we would see this at some point. The system getting out in front of the market, calling the Long basically all week last week, while the rest of the conventional TA’s ranges got tighter and tighter. Bingo – then the little pop outside of traditional TA Resistance up to $1.1970+ level. I’ve tried to teach the system to better recognize channels but to also allow enough room for “out-in-front” leadership – like we saw last week with Friday’s pop. That is why we saw the system be persistent in its “go Long somewhere below the low of the day”, type calls of last week. Being out in front, but not too far out in front, is what I’m trying to teach the system to become very good at.

Again, thanks for these relative comps! Sort, of like the real estate business. You get a bunch of “comps” that all seem to be inline with each other and then boom – you come across a property that just seems to break all the rules – it either sells for much higher than the rest, or much lower even though all the comps seemed pretty much inline for that given market. 😉
 
soccer_daemon said:
Hi 7th,
While the TCD charts show the EUR bottoming during last week, but I suspect
you won't trade on that basis alone with the look and feel of the TCD, right ?
There is always a "possibility" that the bottoming is not yet done and it may turn
up, bounce off the zero line and continue further down, that's the TCD Long I
am refering to. I guess that is where your predictive module comes into the
play and make a quantifiable prediction. Also, to do this sort of statistical
analysis, will it make more sense to have deltas measured in %change instead
of pip-change ?

My pivot for 20/02/2006 (TZ: GMT+11):
pivot: 1.1945 <----- got the wrong value before, this is the one for 20/02/2006.
H: 1.1984
L: 1.1894

Thanks
SD

ps: One more question, sorry about that. Did u ever have observation of
"divergence" on TCD chart when overlayed on to price chart ? 😎)


If you want more refinement you can use percentage change – I do. In some placed within the Engine, I don’t need that level of refinement, but when I’m using Daily data, for example, I’ll more times than not use % change in many of my calculations for better approximation and a tighter overall system. It is up to the designer, really.

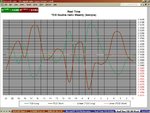
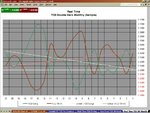
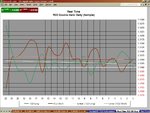
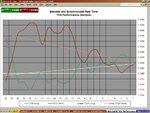
As far as convergence is concerned, yes – it happens all the time – as well it should. The Real-Time TCD’s should be slightly ahead of traditional price charts, but not too far out in front. Of course, this is where some of the Predictive nature of the system comes from. Take a look at these updated Real-Time TCD charts and then go back and study conventional price charts for the past 6 days (which will include that last session). On the Daily Charts, positions 1 – 6 covers the past 6 days of activity.

Notice that on the Blended chart, the green line is now showing that it crossed over the red on position 5 (5 trading days ago). Well, go back and look at any Daily price chart – what do you see? Basically, a bottoming-out of the EURUSD’s short-term price action before last Friday’s move up which was being projected by the system with its “Day Trade” signal Long calls most of last week. Then take a look at the Daily chart at the same position 5 (5 trading days ago). That chart shows that up until that point, the Short TCD’s were in charge – with the most recent negative TCD being the “Long” at position 8. Now, take a look at the Weekly chart. Look at position number 2 (last weeks trading activity). You can now see the result of that “Pincer” move that I spoke about last week where the Short was pointing down towards the zero line steeply and the Long was pointing up to the zero line from underneath it. Both converging on each other having slammed into each other at the start of this weeks trading activity.

Now, the thing to keep in mind here is that these are not price charts! (sometimes when I am doing my visual research and analysis, I have to remind myself of that fact, or even I sometimes get confused)

So, you could very well “see” a green line over a red line, but when you look at the price action for a given session you might notice the price going “down” – not up. These charts are not always indicators of where the price moving at this very minute. Rather, these charts are better indications of where the ”next” large move is most likely to come from. I don’t make decisions based on these charts, but they do help me visualize – or get a feel for where the “next” move is likely to come from. So, from a purely psychological standpoint, I can use these analog charts along with the digital information coming from the Dashboard and “feel” more confident about the “next” move being displayed on the Panel.

Knowing that RT TCD’s do not like to remain under water, helps me understand where the “next” big move needs to come from in order to maintain the systems Price Structure. If you notice carefully, you will see that the Daily TCD’s do not get as negative as the Weekly and the Weekly does not get as negative as the Monthly. So, if I get a Daily Long TCD (for example) that goes negative – that does not always mean that the very next move is Long. But, when I get a Daily Long TCD going negative inside a Weekly Long TCD that is positive and stronger than the Weekly Short TCD, then that tells me that the “next” move typically within the next 24-48 hours should be Long. The inverse is typically true as well.

(see new pics of TCD charts below)

Hope that helps.
 

Attachments

  • Feb 20 to Feb 21 Weekly.jpg
    Feb 20 to Feb 21 Weekly.jpg
    307.8 KB · Views: 321
  • Feb 20 to Feb 21 Monthly.jpg
    Feb 20 to Feb 21 Monthly.jpg
    272.4 KB · Views: 323
  • Feb 20 to Feb 21 Daily.jpg
    Feb 20 to Feb 21 Daily.jpg
    266.9 KB · Views: 314
  • Feb 20 to Feb 21 Blend.jpg
    Feb 20 to Feb 21 Blend.jpg
    257.4 KB · Views: 359
Feb 20-21 Dashboard Panel Update (9:30pm east, 6:30pm pac)

Here, one can see that now the Swing and Outlook Trade Signals have just temporarily moved into "Delta". A visual indicator showing a period of trajectories in transition - a shift in the balance of power making both the Swing and Outlook trade status unstable and un-tradable.

So, they both started with very low probability magnitude in the low 50% region at the Open of this session. Then they moved into "Delta" - meaning their underlying core signal has changed to oppose the one being seen on screen. This shift into temporary delta is confirmation of the fact that both Trade status lights indeed should have been turned "Off", as they were by the system at the Open.

So, once again, the system is demonstrating that it can “think ahead” of certain situations and make the right calls when necessary. There is a lot going on behind the scenes to get these very easy to look at lights and switches to come on and off when they are supposed to, as opposed to when they are not supposed to. As I type, the Delta Indicators for the Swing and Outlook flicker back and forth with market movement. So, there is something brewing on the horizon, for certain. This is also a sign of higher volatility in the near term future.

Ok – great! As I typed, it is also good to see that last sessions Short Target at $1.1918 was just taken out from near the $1.1960 level. So, had I not been available to exit on the 24th hour as I did last session for 40+ pips, I still would have been able to exist last session trade after its target got struck. Which is always nice to see. So, a lot of good stuff happening this week thus far.
 

Attachments

  • Feb 20 to 21.jpg
    Feb 20 to 21.jpg
    290.6 KB · Views: 340
soccer_daemon said:
Actually, I was refering to the "traditional" indicator vs price divergence, ie
when price makes higher hign but TCD Long makes lower high type of
scenario ... but I think I've got the answer from your latest charts.


Is this part of your system upgrade as well ?? :cheesy:

Actually, it is part of the system's genesis and I think any human endeavor beyond the known. Without it, I would not have a fully integrated system, or even a concept for such a system, nor would there be any discovery ever made outside of what is already understood. 🙂

The desire to want to "see beyond" must already be in place before the "beyond" can be seen.
 
7th,

Could you elaborate a bit on the differences between TCD types, such as Tactical vs. Real-time, etc, and also about your "Daily Confirmation" chart you posted earlier on? From what I can tell, that chart is also a type of TCD, but calculated from a different data set (OO/CC vs. HL/LH)

Thanks,

Chuck
 
Feb 20-21 Dashboard Update (10:58pm east, 7:58pm pac):

A triple delta has now emerged. Each signal seen on the Panel has reversed from its Panel display - hence a "delta" in the signal has occurred. Volatility Cycle is now projecting maximum and the Weather Radar is now displaying critical messages. This took about an hour to develop after the Outlook Trade signal first began to flash “Delta”.

So, now – the Day Trade signal is now in Delta which means that the core signal (the primary signal layer) is now Green and Up which happened near the $1.1914 level. So, a dynamic change is taking place inside the system. This confirms the system’s “selection” in going with the Blade/Apex set-up as opposed to the Primary Initial Move and Day profiles.

Now, the level of volatility needs to be contained within the system’s channel projection and this should turn out to be a nice first Advanced trade – we shall see.
 

Attachments

  • Feb 20 to 21.jpg
    Feb 20 to 21.jpg
    295.6 KB · Views: 284
7th, is it possible to consolidate the information on how to read the screen in 1 place? omega, delta etc are not familiar to most of us, although I was a science student before. delta on what? what does all those figures mean and being interpreted? thanks
 
chuck5803 said:
7th,

Could you elaborate a bit on the differences between TCD types, such as Tactical vs. Real-time, etc, and also about your "Daily Confirmation" chart you posted earlier on? From what I can tell, that chart is also a type of TCD, but calculated from a different data set (OO/CC vs. HL/LH)

Thanks,

Chuck


Well, Chuck – a TCD is what I call a Transequential Contiguous Delta (not to be found in a trading dictionary, for sure – each word having a very specific meaning.) and it is a simple mathematical measure between a specific configurations within the OHLC between multiple bars of data. So, it can come from Daily, Weekly, Monthly, 3 minute, 8 minute, 1 hour, 4 hour, etc., data. My basic TCD’s are measures between the high of one bar and the low of another bar. I cannot get into the details and specifics of exactly “which bars” and exactly which OHLC points that I link together, but the gist of the matter is to take a measure between OHLC points across multiple bars of data – locate repeatable patterns – and then build a density probability of price points (at the very basic level) to determine whether price is moving “towards” the cluster of price points, or away from it. Those are the very basics of TCD’s.

So, there is a number of different TCD “types” at this point in the system’s development and I can’t get into the math on the more meaningful types, but my ideas simply came from the prototype TCD which measures the high to low and low to high combination given above. I simply extended the concept to include many different types – but they are all based on the same concept of measurement between bars of data using OHLC in each bar.

It is all about locating repeatable patterns and then developing and retaining those with the highest probability for repeatability. Strategic TCD’s are TCD averages over a selected period of time (like 24 days, 21 Weeks, 20 Months, etc.). Tactical TCD’s use current session high and low data as variable input and Real-Time TCD’s use ONLY “close” data as the variable input into the calculation. So, this gives me the ability to see this basic type of TCD’s as they are developing.

The TCD charts that I posted are labeled by type of data used in the chart. The Blended chart is showing Daily, Weekly and Monthly Real-Time TCD data where each day is keyed to the week and months in which it is running. So, the Blended chart shows 22 days, about 4.4 weeks and a little over one month’s worth of correlated data from the Engine. The other three (3) charts are Daily, Weekly and Monthly respectively and separately. So, you are seeing over 2 years on the Monthly chart and just under a half years worth of data on the Weekly chart. Each chart you see is measured in pips that form the deltas between the various OHLC bars being analyzed. Negative values are possible because of the way the measurements get taken across multiple OHLC bars, in some cases.

There are other critical components within the system, but the TCD concept is a major player, here.
 
nextgen said:
7th, is it possible to consolidate the information on how to read the screen in 1 place? omega, delta etc are not familiar to most of us, although I was a science student before. delta on what? what does all those figures mean and being interpreted? thanks


Yes - I covered this somewhere early in the thread. I went over the major components and described those that are relevant to this thread. I left the advanced trade profiles (Blades/Apex) for later once they came up, before I described them today. So, there is a relevant description for all of the components of the Panel for these Beta and Certification tests - check early on in the thread and then read my post today on the Blade/Apex definitions - that should do it - if not let me know which item needs more explanation.

There are many terms in this system that you won’t understand simply because you have not heard them before used in this context. Many of them I created along with the system as component identifiers. Eventually, each name stuck and was made routine part of the system, for me. Omega is simply a better GUI name given to global variables in the system called DAPD, WAPD, MAPD. Omega is a measure of another type of delta calculation that is very much like ATR, but calculated differently on my end. One name serving three purposes in the system. Omega basically shows me the Magnitude of the current trade.

When the system is running at optimum levels, Omega should run >=100%. The ideal target for Omega by the end of each session is 100% of better. Omega 30 (or, 30%) is historically the point at which the trade begins to take off. It is not “Directional” in nature at that point. Omega 30 has something of a Timing effect attached to it just given the source/origin of its calculations. So, after Omega 30, I expect things to start moving. Omega is a Magnitude Performance Indicator and I like to see it beyond 100% with the price moving in the direction of whatever trade signal the system displays at the time. Inside the Engine, it has multiple functions and I use it in different ways. On the Panel, it is just a good visual performance indicator for me.

This also explains why names had to be created in the first place. There was no conventional naming scheme that I could use, so the next best thing was to create a system vocabulary that describes individual parts. The system has thousands of components developed over 6 years, so getting a system vocabulary in place was critical so that one component could be identified relative to another and used in the proper context.
 
7thSignalTrader said:
Strategic TCD’s are TCD averages over a selected period of time (like 24 days, 21 Weeks, 20 Months, etc.).


I suspected this. I am assuming the Strategics give you a more stable look at what's happening because they are a slower, more 'meandering' version of the TCD's as opposed to the wild peaks and valleys of the Tacticals. Almost too slow, though, from what I can tell. It's very hard to attain any kind of timing from the Strategics and I also see quite a bit of 'headfakes' from these guys, where they appear to start towards a cross and then reverse back the other way. How do you attain any sort of predictive value from them?
 
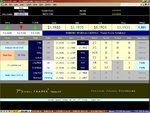
The in-the-money Blade (Short Blade) has been "Cut" (its Limit order struck) for 37 pips.
The out-the-money Blade (Long Blade) has been recursive since the low of $1.1891.
The Long Apex Trade saw a 1 pip draw-down and is now in the black by about 19 pips.

Short Blade at 37
Long Blade at -22
Long Apex at 19

15 pips net/net off the Blades.
19 pips net from the Apex.

That's 34 aggregate pips in a 46 pip range session which represents about 73.9% of all the available pips at a time when many traders saw this session as too narrow to trade. We almost had a strike on the fully recovery at $1.1933. However, I will take these pips and allow the system to update.
 
Back
Top