Active day and swing traders

mm thanks guys, the reason i declared that i have shorted bt at 221 is in response to euro_d request for comments - "Also BT long @ 221, any comments on the latter?".

i dont usually post the price i dealt at, as i have mentioned from the beginning that i did not want to create any issues. but of course, feel free to post urs.

and my percentage gains and losses is based on the account cash balance at the beginning of the month.

if i lost money, i would make sure u know as i often moan on the thread if i lost and also ask for help. as its happened many times.

this thread is to generate ppl interest in trading, whether u loss money or make money, just show us what u have done and lets hope that we can create a community where we can all share our trading ideas and experience. please note. its not a competition, becos, whether u make or u loss, it has no financial effect on me and same as if i make or loss, it has no effect on u either.

so dont let our ego gets in the way.
 
afternoon guys and gals,

STILL inactive - wish I had something constructive to say.

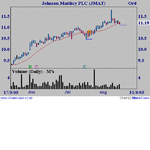
shp triggered long, but I don't take gap openings :( In typical contrary fashion, I'm waiting for a long to trigger in jmat

So far as %age gain is concerned I don't bother, but then it's not my living. I take what the market gives me and don't chase targets of any sort. Without boring you too much, I hope, I know my benchmark performance in terms of %age wins, points gained, £ gained and I review every 50 trades against that benchmark. Well, that's it in a nutshell anyway.

good trading

jon
 
Hi Dave,

Thx for your encouragement. I 'm sure I've posted about my strategy before but it's probably lost iin the aeons of time :) .

I'm a swing trader and base my strategy on Elder's triple-screen trading system. I restrict my trading to FTSE100 stocks (have dabbled in other areas without much success, so decided to stick with what I know and understand). I filter stocks looking for changes in trends signalled by weekly MACD turning points. I also examine whether I'm satisfied that fundamentals justify the change (e.g. if a downtrend is signalled but a stock appears undervalued to me, I won't short it). I then apply Elder's second screen: the Elder Force Index and/or daily stochastic to look for a correction against the trend, trying to enter the trade at a maximum away from the trend. Finally the 3rd screen only allows entry when the price exceeds the previous day's high or low in the direction of the trend (i.e. indicating that the correction is over and the trend is likely to resume). Exit strategy also uses Elder 2nd & 3rd screens in reverse, rather than having a specific price target.

There are quite a few nuances within this and I'm refining it constantly in the light of trading results but that's a basic outline.

Cheers,

Mark
 
Marben.
I have finished reading Come Into my Trading Room,and am now in the process of selecting the best EMA's and indicators to use on my Sharescope charts.
I like his methods and am happy to work with these,am going to using the triple screen method and am taking my time to understand his methods of placing buy a sell orders .I am learning the method of placing a buy or sell order good for one day etc.
To answer your question some posts ago you asked me if he had made any changes to to fist book Trading for a Living.
He has mentioned one change to screen one.to quote "The original version of tripple screen used the slope of the MACD histogram as its weekly trend following indicator.It was very sensitive and gave many buy and sell signals.I now prefer yo use the slope of the WMA as the main trend following indicator on long term charts."end of quote. Hope this helps you.
I cannot work out how he does the force index, therefore I am going to use the stochastisc indicator in stead.I am currently looking at several time periods of EMA's both on the daily and weekly EMA's to see which ones give th most reliable buy and sell signals.I would be interested to see which ones you are now using.
I am hoping to read Trading for a Living in due course.

Regards Jon.
 
barjon said:
afternoon guys and gals,

STILL inactive - wish I had something constructive to say.
Hi Jon,

You'll probably find that a load of great trades suddenly pop into the frame. C'est la vie :) . Your patience wil be rewarded - eventually!

I also agree that trying to reach a particular target is fruitless. It's just useful to benchmark how you're doing and to keep trying to improve your trading.

Good trading,

Mark
 
Hi All.
I have been trading a few stocks for a year or so now and have been investigating Spreadbetting for about 6 months. Yet to make my first real sb trade.

I have been trying to find a workable system and testing various ideas with the sharetrading game on T2W as well as Bullbearings as well as paper trading. Not with enough success to yet take the plunge.

I have just stumbled across this thread and am pleased at the way people are sharing info.
It is, however, now a very long thread and I cannot spend time trawling through it all so I've only gone back a wwek or so.

I agree with Euro-d (#580) that some indication of strategy would be useful.
I have had a look at the longs he specified on #568 but cannot see why he has taken those at that time (although I hold some RTR and am willing them to retrace!)
Some explanation would be useful.

Another area that I and I think other newbies struggle with is "how does one find the stocks to monitor?".
What I am doing is selecting a few sectors which I think I know a little about, selecting from those stocks with a value of 70-700p and sufficient movement/volume to provide some action.
I try to look through those daily for possible set ups.
How do other people search?

Another point that I have learnt and which is not emphasised enough is 'beware of trades before company results, divis, AGMs etc'. In my limited experience there is often a movement beforehand to factor in the expected results followed by a sharp movement (mostly down I think). Anyone care to clarify?
 
Hi ale,

Just to add to your research, basically I am looking for potential trend continuation after retracement. Here's one that shows it, since I've mentioned jmat, and you can see about where I'm looking for another entry. That's the bare bones - I've a few conditions and filters which will preclude a trade even if the basic price movement is right.

As for scanning I, like Mark and Kim, stick to ftse 100 shares and it's not too arduous to whiz through those each night and draw up a list of possibles. I think it was dear old Mully on another thread who said to keep it simple and if it's not obvious ignore it.

I keep clear of upcoming results since the movement can be very sharp either way and catch you out if you're on the wrong side.

There really is no substitute for finding something you are comfortable with and working at it until you refine your own set-up and associated conditions. People usually come a cropper if they try to short cut all the hard work involved by just trying to utilise someone elses method.

Hope that helps.

jon
 

Attachments

  • jmat.gif
    jmat.gif
    8.6 KB · Views: 157
Fluke said:
Marben....
He has mentioned one change to screen one.to quote "The original version of tripple screen used the slope of the MACD histogram as its weekly trend following indicator.It was very sensitive and gave many buy and sell signals.I now prefer yo use the slope of the WMA as the main trend following indicator on long term charts."end of quote. Hope this helps you.
I cannot work out how he does the force index, therefore I am going to use the stochastisc indicator in stead.I am currently looking at several time periods of EMA's both on the daily and weekly EMA's to see which ones give th most reliable buy and sell signals.I would be interested to see which ones you are now using.
I am hoping to read Trading for a Living in due course.

Regards Jon.

Hi Fluke,

I can see that his original version would give too many signals as it didn't really indicate WHICH instruments to trade, just their direction. So I modified that a bit (after visually backtesting against a selection of FTSE100 stocks) to look for CHANGES in the MACD direction from the prevailing trend (for any given stock these usually occur several months apart). I.E. I only considered downturns when the MACD was positive and upturns when it was negative. My backtesting showed that in most cases when MACD changed direction in this fashion, so did the trend. In my early trading, I found that this worked most effectively if I got in EARLY after the change.

Early on, I also used daily stochastic as the second screen. The trouble is that I found that it was a bit too "slow" and I sometimes missed very good trades waiting for it go into the "buy" or "sell" zone. If something is in a serious downtrend, for example, stochastic can stay low for a long time and you miss most of the profit. I also found that "cheating" on the stochastic was a definite no-no: I often found that if I sold when stochastic was half way down and seemed to be heading down sharply (rather than waiting for it to rise above 75% again, which could take a couple of weeks) it would promptly reverse! [aside: I must have fogotten this with today's EMG trade :rolleyes: at least I kept it to half size. I suspect FI will finally be positive when I get today's EOD data - if so I can get the other 50% if/when price goes below previous day's low]. I use Metastock for my EOD charting, with this formula for Elder Force Index (FI):

Mov( VOLUME *(CLOSE - Ref(CLOSE, -1)), 2, E)

The FI is very sensitive, so to avoid too many false signals, I ignore it if the daily stochastic is too close to the "wrong" area. E.G. if a buy is indicated but the stochastic %K is already above 75%, I will wait until %K drops a bit before paying any attention to FI. I will also ignore a signal if price is nearer to an expected target than the stop loss position (i.e. expected profit too low). I'm still experimenting with this aspect of my trading (amongst others!).

FI seems to "lead" better than stochastic which I've found tends to "lag" price movements.

For all these indicators, I've stuck with the standard periods Elder recommends inTfaL: MACD(12, 26, 9); slow stochastic (5, 3, 3), FI smoothed over 2 days. I suspect one could spend forever fiddling with the parameters!

HTH,

Mark
 
ale said:
Hi All.
I agree with Euro-d (#580) that some indication of strategy would be useful.
I have had a look at the longs he specified on #568 but cannot see why he has taken those at that time (although I hold some RTR and am willing them to retrace!)
Some explanation would be useful....

...Another point that I have learnt and which is not emphasised enough is 'beware of trades before company results, divis, AGMs etc'. In my limited experience there is often a movement beforehand to factor in the expected results followed by a sharp movement (mostly down I think). Anyone care to clarify?

Hi Ale & welcome,

I'll try to post more reasoning behind my trade entries/exits.

I'd love to include chart screenshots the way Barjon does but I haven't found a quick and easy way to do this with Metastock. Alt-Prtscr produces rubbish and copying/pasting produces huge files. Obviously I could get there by post-processing but this is too much work to be practical. If anyone's got any SIMPLE ideas on this I'd be delighted.

Again, I agree with Barjon that it's best to avoid expected announcements (unless you're a City insider). I haven't found xd events to be a problem, though, for FTSE100 stocks. I have found it necessary to adjust EOD data to take account of xd events, otherwise you get false price jumps. In TheArb 's book (The UK Trader's Bible), he actually suggests that xd events can be used for a trading strategy: some traders may forget about the event, so the price may not fall by as much as it ought to in early trading the day a stock goes xd, so a quick short at this point can yield profits. This, however, is a day-trading strategy, so not something I indulge in. [No slight against day-traders there, just not my personal style].Try monitoring some stocks with xd's about to happen and see if you observe this.

Good trading!

Mark
 
Thanks Marben.
Is there a good place to go to find what's coming xd?
The BBC2 prog Working Lunch tends to give such info for some companies for the following week but does any site have a calendar of events?
Ale
 
PS ale, forgot to add:

With results announcements, in my exprience, the price often starts moving a number of days before the announcement. This move could be up or down. Once the announcement is out, the subsequent movement depends on whether the announcement is better or worse than expectations. I haven't been able to predict these movements reliably.

I haven't found that the price usually moves down following an announcements but what I have noticed, is that early trades following an announcement are often in the wrong direction. I.E. immediately after the announcement the price starts moving up but a few minutes later turns down sharply or vice versa. I've usually lost money when I've tried to out-think the market on this, so I steer clear of these.

Unexpected announcements, though, are one of the reasons why I also use fundamentals when selecting a stock to trade. If a stock is undervalued, it's more likely to produce good news than bad news.

Cheers,

Mark
 
ale said:
Thanks Marben.
Is there a good place to go to find what's coming xd?
The BBC2 prog Working Lunch tends to give such info for some companies for the following week but does any site have a calendar of events?
Ale
I subscribe to Hemscott which has the upcoming dates for each company. Don't know whether this is available in the free part of their site: try www.hemscott.com. I check this before lining up a trade. My news tickers (AFX/DJ via Proquote) also issue weekly alerts (with analyst forecasts) for forthcoming planned announcements.

I've just started setting up an Access database of FTSE100 companies to make it easier to track this info and record my analysis/notes for each company.

Cheers,

Mark
 
Mark.
Thanks for coming back with your method,nothings easy is it?.
Will be getting Trading for a Living shortly so will be going quiet again till I have read it.

lol.
Regards Jon
 
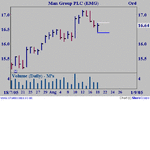
Force index for EMG is NOT yet +ve, so I shan't be taking up the other 50% of the short tomorrow.
 
marben said:
Force index for EMG is NOT yet +ve, so I shan't be taking up the other 50% of the short tomorrow.

Mark

That's a relief - give you three guesses what I'm waiting for :LOL:

good trading

jon
 

Attachments

  • emg.gif
    emg.gif
    7.6 KB · Views: 148
morning all,

closed jmat short, took 2p loss. open new long on bg and cna
 
Mornin all.
Entered UKX long on Camarilla H4 trigger @ 5292 5 pt trailing stop. or 3 consecutive bars negative. Future looks strong, lets see.
Moved BT stop to break even.
BDEV looks as though it migh just hit the stop @ 670 for a 25 pt loss. Cant win em all
IRV & RTR going nowhere yet so patience!
Got BRBY on the radar but would like to see a close above 455 before entering.

Good luck to all
 
Top