Spreadbetting FX using TA

SH-101

Well-known member
Messages
390
Likes
29
Hi,

This thread is my response to a number of posts I've seen here lately as a long-time reader claiming that it's not possible to make any money from spreadbetting on the FX markets, nor is it possible to be consistently profitable using technical analysis alone.

I "trade" or rather, bet, on the FX markets for a living, using pure technical analysis, and this is my record of trades to show that it can be done.

In this thread I will not reveal any of my methods, but suffice to say the reason I perhaps enjoy more success spreadbetting than some is because of my style of trading. I guess you could call me a swing/position trader depending on your definition. I trade mainly off 1-hour charts but also look at 4-hour, daily and weekly charts. I enter and exit all trades with stop/limit orders; I never use market orders.

I tend to trade anywhere from 0-3 times per week depending on signals and I hold trades anywhere from a few hours to a few days, so don't expect this journal to be updated on a daily basis.

To be totally up-front and honest I have added a vendor tag because I do sell a commercial training course (not related to spreadbetting). However please note that I will not post any links to that here nor will I answer PM's regarding it - I'm not touting for business here, I am simply attempting to show some of the doubters that success can be achieved using technical analysis and spreadbetting. If the mods are not happy with this then please close the thread and accept my apologies.

I won't reveal my methods or position sizes here but suffice to say I risk 4% of my account on each trade, and adjust position size depending on stop size to ensure that the risk is the same on all trades. The ability to adjust position size in single-penny increments is one of the reasons I prefer to spreadbet rather than go DMA.

As I begin this journal I am currently on a healthy winning streak, so I have no doubt that things will be evened up with the odd losing trade early on! :) If I do find that running this journal on a public forum has any negative effect on my trading performance I may close it down.

For what it's worth I have one current open position, which is short EURJPY from 123.98 bid. Stop is at break-even and target is 121.30 offered.

At the moment I see no other obvious trades on the horizon, but as always I will patiently await the next opportunity.
 
sounds very interesting, I have been demo trading with a similar style now for some time. its often difficult to let winners run and needs good discipline
 
Hi SH-101,
Welcome to T2W!
Your journal sounds interesting, I'll follow it with interest. While I appreciate fully that you don't want to go into the details of your strategy(s) - posting a chart with entries, exits and any other notation you'd care to include would be useful. Given that part of your stated aim of the thread is to illustrate that it is possible to do well with TA, an insight into your broad thoughts on the subject would be useful. If you use any MAs or indicators, perhaps you could at least include them on your charts, even if you elect not to explain how and when you use them.
Cheers,
Tim.

Hi Tim

I appreciate your comments - I do intend to post charts and will of course go into some basics about my approach to TA, hopefully it will be enough to give people some insight.
 
To clarify a little about my approach -

I am a trend follower. For the most part my approach is based around trading in the direction of trends after a pullback. In an uptrend I'll wait for a pullback to support, then look for signals that the trend is ready to resume. I'll do the same following a pullback to resistance in a downtrend.

The signals I look for are based around divergence - the only way to turn lagging indicators into leading indicators. I look at various methods of determining support and resistance.

Typically my successful trades give a return of between 1.5:1 and 2:1 reward/risk.

My specific method of determining the trend, the divergence indicators and the settings I use and one or two other things won't be posted to this journal but I'll try to post charts using other indicators to explain the setups in an "equivalent" fashion and give some idea of how things work.

I'll post to this journal when I place an order, and when an order is either pulled, filled or moved.
 
To clarify a little about my approach -

I am a trend follower. For the most part my approach is based around trading in the direction of trends after a pullback. In an uptrend I'll wait for a pullback to support, then look for signals that the trend is ready to resume. I'll do the same following a pullback to resistance in a downtrend.

The signals I look for are based around divergence - the only way to turn lagging indicators into leading indicators. I look at various methods of determining support and resistance.

Typically my successful trades give a return of between 1.5:1 and 2:1 reward/risk.

My specific method of determining the trend, the divergence indicators and the settings I use and one or two other things won't be posted to this journal but I'll try to post charts using other indicators to explain the setups in an "equivalent" fashion and give some idea of how things work.
I'll post to this journal when I place an order, and when an order is either pulled, filled or moved.

Red - good technique
Blue - Boo!!! ;) (but understood)

What TF buddy, 3-4hr or dailys?
 
Good stuff. I'll look forward to it.
There has been a bit of an 'anti TA' theme on the forums for a while now.
DionysusToast and theexpert spring to mind, in recent times. Nothing against them though. I actually quite like both of them for different reasons!

It can be disheartening, especially for newbies, to be told flat out that TA is useless, especially with the lack of information regarding any other alternative.
The anti TA brigade dont tend to really provide any details in enlightening anyone.

There was the 'trading without charts thread' a little while ago. About 30 pages long, and at the end of it, nobody was any the wiser about what John1(i think that was the poster who provoked most questions) was even talking about!
He said he didn't use fundemantals...or charts/TA...or level2/DOM/time+sales info....or tea leaves.
Everyone left the threads scratching their heads.

I find it hard to believe that just saying what it is you use would be giving the game away, and that just knowing that information would suddenly make anyone who knew it profitable!
Surely anything would still require hard work/time and practice.

'Theexpert' has a thread running at the moment, apparently to teach people. readers spent the first 10 pages trying to analyse graphs, without knowing what the data represented! no labes on the charts at all. Why one wouldn't just say 'this is a chart of KLAC and this graph shows the daily range and the volume' (for example) I dont know!

Anyway, back to your OP.
There are without question, people who are very consistent and successful with just trading the charts. I traded in a free private skype room for a while with some excellent traders who made a killing every day.
Im nowhere near where i hoped i would be when i began getting interested in trading about 7 years ago. Not gonna lie. However, over the last few years I have began to get some decent consistency in my own trading, losing days scattered amongst many more winning ones. I know its possible. Its NOT easy!

Maybe if the nonTA guys were a bit mnore giving with their info (like the TA people are) then we'd get the best of both worlds, and reach our goals quicker.

Good luck
 
Good stuff. I'll look forward to it.
There has been a bit of an 'anti TA' theme on the forums for a while now.
Good luck

Themes come and go.

When i found this site, it was all about "darksiding" and everyone was a darksider, now i never see this word anywhere. The ones who did it are mostly banned, and apparently its all been thrown out in favour of a new theme.
 
Good stuff. I'll look forward to it.
There has been a bit of an 'anti TA' theme on the forums for a while now.
DionysusToast and theexpert spring to mind, in recent times. Nothing against them though. I actually quite like both of them for different reasons!

It can be disheartening, especially for newbies, to be told flat out that TA is useless, especially with the lack of information regarding any other alternative.
The anti TA brigade dont tend to really provide any details in enlightening anyone.

There was the 'trading without charts thread' a little while ago. About 30 pages long, and at the end of it, nobody was any the wiser about what John1(i think that was the poster who provoked most questions) was even talking about!
He said he didn't use fundemantals...or charts/TA...or level2/DOM/time+sales info....or tea leaves.
Everyone left the threads scratching their heads.

I find it hard to believe that just saying what it is you use would be giving the game away, and that just knowing that information would suddenly make anyone who knew it profitable!
Surely anything would still require hard work/time and practice.

'Theexpert' has a thread running at the moment, apparently to teach people. readers spent the first 10 pages trying to analyse graphs, without knowing what the data represented! no labes on the charts at all. Why one wouldn't just say 'this is a chart of KLAC and this graph shows the daily range and the volume' (for example) I dont know!

Anyway, back to your OP.
There are without question, people who are very consistent and successful with just trading the charts. I traded in a free private skype room for a while with some excellent traders who made a killing every day.
Im nowhere near where i hoped i would be when i began getting interested in trading about 7 years ago. Not gonna lie. However, over the last few years I have began to get some decent consistency in my own trading, losing days scattered amongst many more winning ones. I know its possible. Its NOT easy!

Maybe if the nonTA guys were a bit mnore giving with their info (like the TA people are) then we'd get the best of both worlds, and reach our goals quicker.

Good luck

Good post, vendors of trading rooms have to mystify their approach otherwise they'd get subscribers for a month, they'd learn a couple of simple techniques and then pi55 of and do it themselves...therefore the *invention* of Price Action..."can you see it yet?" which keeps 'em coming back for months/years...

I've noted 2 'famous' PA zealots actually appear to take trades on the MACD x-over on its fookin standard settings...then get out at pre-determined levels, what are the chances eh...? :whistling

Don't get me wrong PA does *work*, but I can't use PA on the 7-9 pairs I trade on a daily basis off 15-30min charts, I've got to be able to look at my charts, after receiving an early warning alarm, and be in yes or no...and that decision is based singularly on the probability of "if 5 out of 6 of my indicators line up, then the trade will probably go in a certain direction..my favour.."

But that's were it gets difficult; donig the same technique day after day with total commitment and discipline is much harder than learning the technique; whether that be PA or using TA or a combination with fundamentals...

I'm currently in 8 trades, 5 taken this morning, all in profit, all taken through a v.simple TA strat..arguably perfect entries on the latest but I'm now completely at the mercy of the trillions of buyers and sellers in the market and it's all about self management of those trades...some'll stop me, out, some'll hit limits, I'll manually bail out some early to lose 15 pips versus 30...how we react and adapt is one the keys to success in this game...

Gotta go..need to chart watch..;)
 
  • Like
Reactions: BSD
Hi all,

My EURJPY short hit target overnight, which was a nice thing to wake up to, although as the entry wasn't posted I won't "count it" as such and this journal still awaits its first trade. You may however be able to see the bearish divergence on the 4-hour chart which preceded this last downward swing.

I see some early potential for a cable long and/or EURGBP short, but nothing concrete at this stage and I suspect my trading may be done for the week.

BTW Just noticed a typo in my first post - I risk 5% of my account per trade and not 4%. I know that's a little higher than is generally advised by most professionals but I have enough confidence in my approach to take that level of risk.
 
Last edited:
What TF buddy, 3-4hr or dailys?

Hi Black Swan,

I tend to take most of my trades off of signals on the 1h chart and sometimes the 4h. I prefer a multi-timeframe approach so I tend to look at dailies, weeklies etc to establish overall trend.
 
Watching EURJPY at the moment.

Entry order placed to sell at 120.64 bid, if-done stop 121.73 offered, if-done target 118.50 offered.

Orders will be pulled if market rallies and breaks the previous hourly high around 121.65.

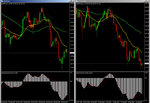
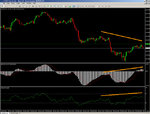
Screenshots: As mentioned previously these are not the specific technical indicators I use. They simply show similar things - the broad overall theme of my approach.

The first screenshot shows a 4-hour chart and a daily chart. Both show the 20-bar EMA (yellow) sloping down. Both show the 60-bar SMA (green) sloping down. Both show the 12/26/9 MACD crossed down. These are reasonable technical indications of a downtrend on these longer-term charts.

The second screenshot shows "hidden divergence" on MACD and a 14-bar RSI on the 1-hour chart. This is marked by the yellow lines and is a sign of potential trend continuation. The green dotted line shows an area of previous support which may hold as resistance now that it has been tested from the "underside".
 

Attachments

  • eurjpy1.jpg
    eurjpy1.jpg
    156.7 KB · Views: 362
  • eurjpy2.jpg
    eurjpy2.jpg
    157.2 KB · Views: 321
Last edited:
My EURJPY order has been filled, so am short. The trade has almost immediately taken off the opposite way :LOL:

I enter my short trades at areas others will perceive as support, and I enter longs at areas others will perceive as resistance. This is part of what gives me my edge, but it does also mean that when I get a trade wrong, I often do so in spectacular fashion!

My most recent loss was on GBP/JPY back on the 9th of this month. On that occasion the trade went just half a pip into profit before reversing spectacularly and taking out my 100+ point stop in just over an hour.

If this trade is stopped I am actually nonetheless expectant that I will be looking to short the pair again at another resistance area I have observed above the most recent high. For now though, I am unconcerned - an immediate reaction against my position is a regular occurrence and for now, I'm off to the pub (y)
 
Stopped out of EURJPY for a loss, as perhaps expected (see post #1 :)). Not to worry - losses are part of trading and February was nonetheless a nicely profitable month, although of course I understand that readers will want to take such claims with a pinch of salt until some winning trades have been posted to this journal.

As noted in my previous post I may still be interested in shorting EURJPY again - we'll see how things pan out.
 
Some further information about my trading.

I'm not one of these traders who is on a quest to make as many pips as possible. As we know, you can average +1 per week and still make tremendous money if your capital level is sufficiently high!

I don't actually think in terms of pips anyway, it's an irrelevant measure given that I vary my position sizes from trade to trade. I think in terms of percentages.

As mentioned previously I risk 5% of my trading capital on each trade and most of my winners fall in the range of 1.5:1 to 2:1 risk/reward, meaning that a typical winner returns 7.5-10% on my capital.

My minimum target each month is to make make a return of 10% on my capital. Typically two winners and a loss will achieve that. Anything more than that is gravy, so if I can arrive at the end of the month having won, say, three more trades than I've lost then I'm a very happy man :D I'm not on a mission to win a million trades a month so I can be quite choosy over my trades.

I only consider my capital level at that start of the month and the end of the month. This means that if I start the month with X in my account, then on every single trade that month I will risk 5% of X regardless of the fluctuations of my balance. If I start the month with a winning trade, this increasing my total capital, I'll still only risk 5% of X on each trade. Similarly if I start the month with a loss, reducing my total capital, I'll still risk 5% of X on the next trade.

At month's end I take out any profit, leaving X in the account for the next month.
 
I have an eye on AUD/JPY at the moment.

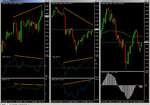
In the first screenshot below, we have established a technical downtrend on the daily chart. Price is below the 60SMA, and the 60SMA is sloping downwards. MACD is crossed below zero and below its signal line. Again - these are not the indicators I use, but they do show a similar thing.

The central chart shows "bearish hidden divergence" on CCI(14) and Momentum(14) indicators. This is a sign of trend continuation - a continuation of the downward movement on the daily chart.

The left-hand chart shows "bearish regular divergence" on CCI(50) and RSI(14) indicators - indicating a potential reversal of more recent upward movement.

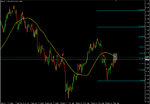
The second screenshot shows the market bouncing from both a key fibonacci retracement and the 50-bar SMA on a 4-hour chart, with the dotted green line showing that price has found resistance in this general area before.

My entry order has been placed to sell at 80.22 bid, if-done stop 80.92 offered, if-done limit 79.00 offered. Orders will be pulled if market breaks the previous hourly high.
 

Attachments

  • audjpy1.jpg
    audjpy1.jpg
    477 KB · Views: 232
  • audjpy2.jpg
    audjpy2.jpg
    343 KB · Views: 214
Back from an extended late lunch :)whistling) to find my sell order has been filled. The usual "opposite" reaction then took place with the market rallying 35 points or so before settling down.
 
Decided to get out of AUD/JPY for break-even. After taking a long time to go pretty much nowhere, I was hoping for a push lower on the ADP report, but instead it's bounced up a wee bit instead. On top of that, I realised this morning that I made a miscalculation on the entry which I believe means my target is less likely to be hit than under ordinary circumstances.

As a result I decided my capital would be better off being put to work on the next opportunity that arises. I may still live to regret this decision as there is no real technical reason for exiting this trade, but as I mentioned before I only need a couple of winning trades a month to hit my target, so I can afford to be quite picky with my trades. I have a bit of an adage in my trading and that's that it's better to miss a winner than trade a loser :)
 
Last edited:
Top