Price

  • Thread starter Thread starter wasp
  • Start date Start date
  • Watchers Watchers 12

wasp

Legendary member
Messages
5,107
Likes
880
No trolling
No Flaming
No pointless arguments
No ego
No predictions required

__________________________________________


A thread for random charts, of your choice, any market and any timeframe. Feel free to add your own charts and thoughts, not everyone trades the same thing or just candlesticks etc so more views the merrier.

There is no singular view or goal, just a thread to look at a blank chart, and get different views for traders of all levels to pick and point opinions and views of whys and hows, to help all.

Not here to show off but to discuss price movements so hindsight is fine.
 
Last edited:
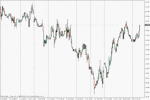
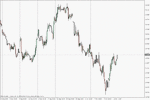
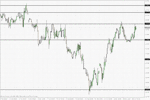
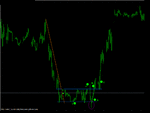
Cable

Nice clean, simple cable chart.........

annotations coming from me later...!
 

Attachments

  • cable.gif
    cable.gif
    21 KB · Views: 1,361
  • cable 2.gif
    cable 2.gif
    17.8 KB · Views: 399
Last edited:
Ym

and the dow
 

Attachments

  • ym.gif
    ym.gif
    23.9 KB · Views: 411
  • ym2.gif
    ym2.gif
    23.6 KB · Views: 363
post comments, draw all over it, colour it in.... whatever, just post thoughts on understanding the buyers and sellers to kick start discussions and help noobs see more than a load of candles making no sense.........
 
post comments, draw all over it, colour it in.... whatever, just post thoughts on understanding the buyers and sellers to kick start discussions and help noobs see more than a load of candles making no sense.........

If you look closely, and move from candle to candle, looking at the high, low, open and close, each and every candle should make good sense.

If you go one step further, and see how this information relates to the still active (not yet been breached by a close beyond this level) S/R levels on the charts (where price has turned momentarily or for an extended period of time), the picture should become an awful lot clearer.

But it can be difficult to do this all with just a screenshot without knowledge of the EXACT values of the OHLC as would be so if scrolling through a chart. In terms of coming up with consistent conditions etc.
 
Last edited:
If you look closely, and move from candle to candle, looking at the high, low, open and close, each and every candle should make good sense.

If you go one step further, and see how this information relates to the still active (not yet been breached by a close beyond this level) S/R levels on the charts (where price has turned momentarily or for an extended period of time), the picture should become an awful lot clearer.

But it can be difficult to do this all with just a screenshot without knowledge of the EXACT values of the OHLC as would be so if scrolling through a chart. In terms of coming up with consistent conditions etc.

Interesting, could you post an example?
 
wasp wants this thread to stick strictly to the topic without diversions however innocent and/or humorous. so modding a bit heavily - and this will go in due course.

jon
 
Good thread Wasp

Nice clean, simple cable chart.........

annotations coming from me later...!


41278d1224067406-price-cable.gif


good thread Wasp

Price rejected lower and if you pull up a higher tf chart you will see price is just above 50% of the Bull run date back from 2001 (could be significant ?/ pinbar higher timeframe forming (candle/bar HOT)

range hours 6th- 7th-8th Oct

price second re-test at R top hours so presents possible range trade (short) hours

price hours = reverse H&S pattern forming, not triggered imo but in play and target (size of pattern = 1000 pips I think ? new to pairs world 🙂 correct if wrong please

Target hit would set up re-test @ 18500-800 zone / double top in day tf (38% - 50 % fib zone from Nov 07 high @ 21161 ) if price runs higher it will run in to possible R at the reverse of Bull trend line from 2001 visable on 1/4 - day timeframes

Price is making its 1st re-test of higher timeframe swing low, visable best in 1/4 and month timeframe July 05 - April 06


Andy
 
Last edited:
If you look closely, and move from candle to candle, looking at the high, low, open and close, each and every candle should make good sense.

If you go one step further, and see how this information relates to the still active (not yet been breached by a close beyond this level) S/R levels on the charts (where price has turned momentarily or for an extended period of time), the picture should become an awful lot clearer.

But it can be difficult to do this all with just a screenshot without knowledge of the EXACT values of the OHLC as would be so if scrolling through a chart. In terms of coming up with consistent conditions etc.


OI JT! Have you traded today?

😎😎😎

I'm watching you son...
 
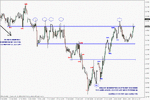
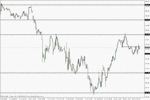
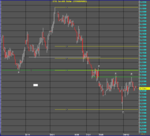
simplicity of key levels

Personally, one of the first things I look for in a chart is the key S/R levels.......
 

Attachments

  • sandr.gif
    sandr.gif
    15.8 KB · Views: 389
  • sandr2.gif
    sandr2.gif
    29.3 KB · Views: 323
  • sandrym.gif
    sandrym.gif
    24.8 KB · Views: 327
At what point has price reversed? And would you wait for the trend reversal to be confirmed to enter? Several points annotated... you can call them what you want or do with the chart whatever you feel like. I've removed time, date, instrument and price levels because they are irrelevant: price is price.
 

Attachments

  • reversal.gif
    reversal.gif
    14.8 KB · Views: 388
At what point has price reversed? And would you wait for the trend reversal to be confirmed to enter? Several points annotated... you can call them what you want or do with the chart whatever you feel like. I've removed time, date, instrument and price levels because they are irrelevant: price is price.

Whilst I agree they are irrelevant, could you tell us anyway so I can load up my own chart as I don't have any sunglasses to hand to stare at yours!
 
http://www.trade2win.com/boards/attachment.php?attachmentid=41304&stc=1&d=1224079502

http://www.trade2win.com/boards/attachment.php?attachmentid=41306&stc=1&d=1224079502

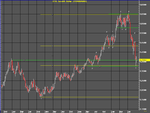
"P" marks a Pivot Price; notice how Pivots in the past act as Pivots in the present. Sometimes you will find the market attracted to these Pivots, "sticky prices": trundling along from one P to another, backwards and forwards.

Also note the confluence of psychological levels. Much like a Dog, price moves from P to P, stopping for a sniff each time. If it wanders into unchartered territory, it will stop for a "P" of it's own... oddly, about a "P"s distance away from the last.


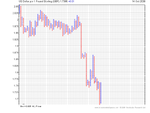
Bladerunner, can you talk us through your PnF chart?
 

Attachments

  • EURUSD_Weekly.png
    EURUSD_Weekly.png
    18.6 KB · Views: 464
  • EURUSD_240.PNG
    EURUSD_240.PNG
    61.7 KB · Views: 419
At what point has price reversed? And would you wait for the trend reversal to be confirmed to enter? Several points annotated... you can call them what you want or do with the chart whatever you feel like. I've removed time, date, instrument and price levels because they are irrelevant: price is price.


Give us a clue mate was it Oct 10 2008, the date in question?
 
http://www.trade2win.com/boards/attachment.php?attachmentid=41304&stc=1&d=1224079502

http://www.trade2win.com/boards/attachment.php?attachmentid=41306&stc=1&d=1224079502

"P" marks a Pivot Price; notice how Pivots in the past act as Pivots in the present. Sometimes you will find the market attracted to these Pivots, "sticky prices": trundling along from one P to another, backwards and forwards.

Also note the confluence of psychological levels. Much like a Dog, price moves from P to P, stopping for a sniff each time. If it wanders into unchartered territory, it will stop for a "P" of it's own... oddly, about a "P"s distance away from the last.


Bladerunner, can you talk us through your PnF chart?


sure MrGecko

latter.. (am)

off outsky..................

Andy
 
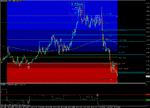
Worthy of note re price is the sellers overwhelming the buyers at areas of support that became resistance...resistance that got stronger as it was tested and held...the latest being this afternoon's sharp sell off from the Resistance zone shown in the chart below. [7595-7432 at time of writing.]

The instrument is the gbpusd. I agree with Wasp re marking previous swing Hi and lo areas on a chart to ascertain where potential support/resistance resides. Doing so on the 1hr chart and above is most likely to be replicated by the money that moves the market.
 

Attachments

  • 1hr resistance zone.gif
    1hr resistance zone.gif
    18.8 KB · Views: 289
Back
Top