p&f ................ Price
sure MrGecko
latter.. (am)
off outsky..................
Andy
Hi MrGecko
Use manual ones in real time on Ftse
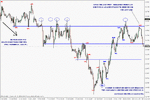
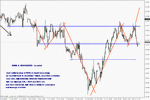
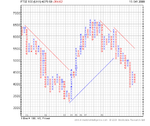
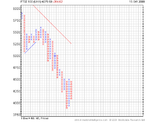
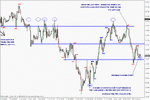
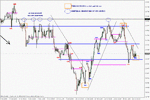
Just find it defines range / price extremes better, those circles on wasps chart are real good but I just never seem to see them in real time so clean so returned to p&f small box real time
no time aspect to them, trade a few sessions with them (bit violent at the moment for getting used to them
🙂
Stops me getting shaken / faked in and out / stops defined etc ...plan trades better etc
I find live charts a bit .........well I can start re-acting to them
cuts out the mid-range ... arrrrrrrr sh...t its turning feeling ....... oh no its not
sh.........tttttttttttttttttttttt !!
😡 +5 :-(
Emotional, thats how I ended up a scalper/small run trader
🙂
Don"t use them in traditional way (patterns)
If you look at a manual drawn one in real time you will find each run relates to a trend in the lower tf, eye opening if you watch side by side ... see how price gets from A-B
😱
db used to say / posted ~ I don"t give a sh..t how it gets there ....so long as it does more often than not
useful links for anybody interested ~
Marc Rivalland.com
removed bad link = Stockcharts
Investors Intelligence
Top one tells you how to construct a traditional one (intraday you will need small box)
5pts ok on ftse ..........err sorry 10 at the moment
🙂
timsk is ..........well he is more traditional in his approach and understanding. I read up on them and thought they might come in handy
🙂
Andy


