wot happened next revisited

barjon

Legendary member
Messages
10,752
Likes
1,863
Inspired by recent discussion prompted by twistedhedgehog http://www.trade2win.com/boards/price-volume/37898-markets-those-involved.html and paricularly by jtrader's reading of the candles http://www.trade2win.com/boards/candlesticks/38026-every-candle-tells-story.html I thought I'd try a new wot happened with a different flavour that may interest anyone interested in following in jtrader's footsteps.

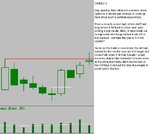
What I've done is to take one of my old trades together with extracts from my notes taken at the time. I will go through it candle by candle with a new candle for you to consider each day. I hope you'll give it a stab and post your own interpretations. Have fun - here we go with the starter.

good trading

jon
 

Attachments

  • wot 3.JPG
    wot 3.JPG
    61.6 KB · Views: 1,396
Sorry Jon, do you want us to just add thoughts as each new candle appears and what we do each day/candle and our thoughts just as things stand (what's going on) or are we trying to look forward and say what will be?
 
Sorry Jon, do you want us to just add thoughts as each new candle appears and what we do each day/candle and our thoughts just as things stand (what's going on) or are we trying to look forward and say what will be?

Add thoughts on the intial starter and then as each candle appears, i think, which may stray into what comes next - you can look at it as managing the trade maybe and what thoughts occur to you as it develops.

good trading

jon
 
What I've done is to take one of my old trades together with extracts from my notes taken at the time. I will go through it candle by candle with a new candle for you to consider each day. I hope you'll give it a stab and post your own interpretations. Have fun - here we go with the starter.

good trading

jon
I see.

I don't know about volume, as i only look at fx, but based on the candles, do you think the volume factor is crucial to this exercise or not? I would hope not !

But, i can say forward suggestions/theories/rationales like -


39404d1220444872-wot-happened-next-revisited-wot-3.jpg


Because of the failure 1 candle back to pass above the close, or pass above the high of the upward closing candle 6 candles prior to it, with the resistance that that candle formed, and the fact that the last candle closed down, without passing the previous candles high, i think the next candle may go down further, possibly to retest the prevous support level of 2 candles previously initally, where it may or may not find support....


Cheers.
 
Last edited:
Add thoughts on the intial starter and then as each candle appears, i think, which may stray into what comes next - you can look at it as managing the trade maybe and what thoughts occur to you as it develops.

good trading

jon

Crystal clear!

Paintshop pro would be useful to annotate the attatchments. Unfortunately i don't have it.
 
Numpty dumpty analysis

What I've done is to take one of my old trades together with extracts from my notes taken at the time. I will go through it candle by candle with a new candle for you to consider each day. I hope you'll give it a stab and post your own interpretations. Have fun - here we go with the starter.

good trading
jon

This is so far removed from how I normally look for a trade (yes with indicators) but I'll give it a go.

1. new high => uptrend so retrace and breakout of uptrend is a distinct possibility
2. inside bar (2nd from left) shows consolidation. I would consider a breakout trade of this bar.
3. what is the significance of the lower volume of 3rd bar from left?
4. Candle1 looks like indecision to me.
5. strong buying pressure in candle2 but from strong or weak hands?
6. normal for profit taking to occur by short term traders in candle 3 following a large move. The fact that is closed above 50% of candle2 is a good sign.
7. if i entered long on candle1 breakout I would be feeling a bit twitchy as I have no idea what is coming next!
 
Inspired by recent discussion prompted by twistedhedgehog http://www.trade2win.com/boards/price-volume/37898-markets-those-involved.html and paricularly by jtrader's reading of the candles http://www.trade2win.com/boards/candlesticks/38026-every-candle-tells-story.html I thought I'd try a new wot happened with a different flavour that may interest anyone interested in following in jtrader's footsteps.

What I've done is to take one of my old trades together with extracts from my notes taken at the time. I will go through it candle by candle with a new candle for you to consider each day. I hope you'll give it a stab and post your own interpretations. Have fun - here we go with the starter.

good trading

jon
I'll have a go.

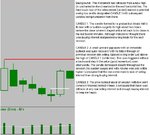
1: The entire procession of "down" candles only just manages to break the low of the first candle in the picture. This would indicate to me that there is no panic or frenzied selling going on. More like general consolidation and profit taking from earlier long positions. Further, volume begins to increase from after the second down candle and does so steadily with no sudden explosive spikes.
2: On candle "2" volume does increase, though only marginally and candle shows strength to nearly entirely wipe out all the preceeding "down" candles. Closes near the high. However, candle does fail to break recent previous high. Cause for concern?
3: Last candle volume is almost as much as candle 2 but candle closes only slightly lower. This would indicate to me there isn't any urgent selling going on. More a jostling for position on either side would be my guess.
4: If I were to take a guess I would say I'd expect price to move higher and at the very least test the previous high within the next candle or two.

Cheers,
PKFFW
 
How to insert images into a T2W post - like in my post above

find an image on any web page, ricght click to get image property/image location, copy.

Click insert image icon in T2W thread, paste in image location address.

if you are using an image of your own upload it to a hosting provider like imageshack.. you will be given direct link to image address.

Some images may prevent linking to them, but most still do.
 
Thanks jt - I'll try that sometime :confused:

In the meantime here's the next one - CANDLE 4

Thanks for contributing guys - there's some interesting perspectives.

good trading

jon
 

Attachments

  • wot4.JPG
    wot4.JPG
    42.2 KB · Views: 996
Oh, look it works!! Here's CANDLE 4 embedded. Thanks again for your contributions.

39464d1220522148-wot-happened-next-revisited-wot4.jpg
 
small body higher volume

I would be out ~ but will move my stop just under candle for the exercise :)

lower high instrument still in new ground


Andy
 
Last edited:
Oh, look it works!! Here's CANDLE 4 embedded. Thanks again for your contributions.

39464d1220522148-wot-happened-next-revisited-wot4.jpg
Here's my next take....

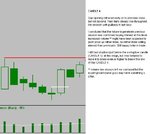
1: Gap up opening shows buying interest I would think. Closing the gap to previous low and holding above that low shows this is a level participants are willing to buy at.
2: The fact the candle also closed higher than the preceding two would indicate that whilst there is increased numbers of sellers entering(see next two) there is also still plenty of buyers.
3: Candle can't hold it's high and increased volume with a comparatively small candle does show sellers are increasingly coming in.
4: Failure to reach previous swing high also shows this is an area of increased selling activity.

Personally I would be moving my stop to break even or possibly even to just below the lows of candles 3 and 4 as a precaution. However, I would still be expecting at least one further push to test that recent high.

Cheers,
PKFFW
 
Feeling more relaxed in the trade after seeing candle4 - renewed buying interest on higher volume.

Wouldn't move my stop just yet, give the trade time to breathe.
 
39464d1220522148-wot-happened-next-revisited-wot4.jpg


LONG/UP - The next candle should "move" upwards, probably testing the resistance, just above from 8-9 candles back.
I base this on the fact that this last candle - closed up, doesnt look to have made a lower low, and passed above (and even closed above) the previous candles high - indicating strength.
Whether or not that resistance will be broken and the next candle closes up, i don't really no.
 
I think I might learn a fair bit here even though it's pretty far removed from what I've looked at so far.

I'd be looking to move my stoploss to break even now. Like JTrader I'd expect to see the recent high tested with some resistance at the low of the last two candles. Wouldn't have my stop at the low of the last two candles as I feel the level wouldn't offer a great deal of resistance with the price possibly dropping through it before pushing back up towards the high again.
 
...and CANDLE 5 for those still following along. Next one not 'til Monday I'm afraid.


39522d1220565705-wot-happened-next-revisited-wot-5.jpg
 

Attachments

  • wot 5.JPG
    wot 5.JPG
    40.6 KB · Views: 1,099
Now I'd move my stoploss just below the low of candle 4 / close of candle 3. I think there's more interest to buy there but am wary of a sharp fall should selling pressure build up. I'd like to put myself in a position of profit here regardless of what happens but I feel the price could get as low as the low of candle 4 before moving on through the high again.

Thanks again for doing this Barjon. One of the first things I tried was just reading candlesticks on historical charts but I was doing it with so little structure that I got very little out of it. I think I'm going to learn a fair bit by participating in this thread.
 
...and CANDLE 5 for those still following along. Next one not 'til Monday I'm afraid.


39522d1220565705-wot-happened-next-revisited-wot-5.jpg

Long again - I see more upside. We have a new high above resistance, and the last candle did show some other signs of strength, with a higher low, higher high & higher close.
 
...and CANDLE 5 for those still following along. Next one not 'til Monday I'm afraid.


39522d1220565705-wot-happened-next-revisited-wot-5.jpg
1: New high has been made.
2: Candle did open and close higher than previous candles and even managed to close above the previous candle high.
3: Couldn't hold new high with clear rejection back below the previous resistance.
4: Significantly reduced volume. Could show not enough buying interest to push through resistance and continue upward movement. Maybe simply market participants waiting for clearer sign of direction before entering.

I would also have been taking half the position off the table. I would definately move my stop on remainder to just below the lows of candles 3&4. That area showed buying interest so may provide short term support for another upward charge. If not, I get out with what I have.

Cheers,
PKFFW
 
...and CANDLE 5 for those still following along. Next one not 'til Monday I'm afraid.

Price made a new high on lower volume. This could indicate a lack of enthusiasm from sellers pushing the price up.

Higher lows/highs are being made which is an encouraging sign.

Everybody will have been eyeing the breakout. There could be an attempt to retrace, scaring the weak longs, before a further breakout to new highs.

I would now move the stop to BE. Putting the stop below candle 4 could be a bit too close if stop hunting occurs. Now that I have a free trade I just sit back and relax.
 
Top