You are using an out of date browser. It may not display this or other websites correctly.
You should upgrade or use an alternative browser.
You should upgrade or use an alternative browser.
Articles
Filters
Show only:
Loading…
A large number of traders that I work with express the feeling that they are somehow sabotaging themselves: repeating the same mistakes day after day, giving back valuable profits in a fraction of the time it took to earn them. Their intuition is that there is some kind of pattern to what they're doing; they're repeating the same mistakes again and again. They realize that they're not mentally ill and don't have a history of out-of-control behavior, so they are understandably confused as to why they can't stop shooting themselves in the foot.
In this article, I will summarize a few ideas central to brief therapy, a discipline which uses very active techniques to accelerate change processes that might otherwise take months or years...

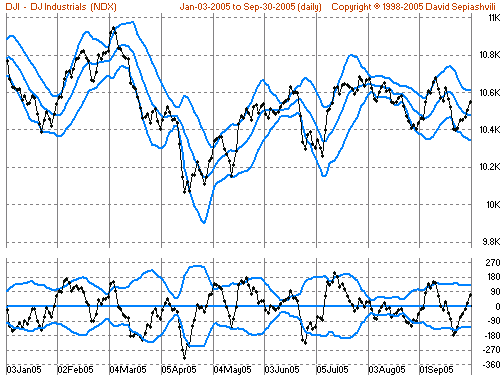
As is the case with other markets such as commodities, forex demonstrates patterns of "seasonal" behavior which can be traded. These calendar patterns vary from pair to pair due to the dynamics of the currencies involved. In this article, the Yen (JPY) is the focal point, though there are similar patterns of action in other ares of the foreign exchange market.
Monthly Patterns
If one first takes a look at the market from a monthly perspective, it can be seen that USD/JPY and the JPY-based crosses have months in which they demonstrate clear tendencies. The figures below outline this. The graphs takesa month-by-month look at USD/JPY since 1999 (seven years total), which encapsulates the time since the launch of the Euro, an important...
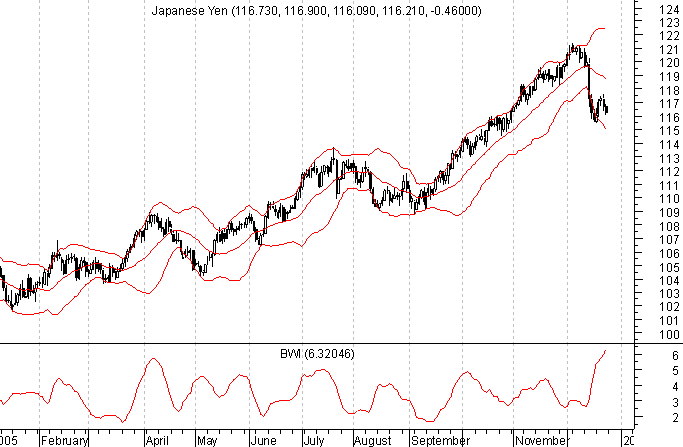
Bollinger Bands are among the most commonly found technical indicators these days. Even the most basic of charting applications include them among the available offerings. There are many ways the Bands can be incorporated in to one's market analysis and trading methods (see Bollinger Bands - The Basic Rules for a discussion). This article focuses on how they can be used to find markets in the early stages of significant directional moves.
The process of trend identification using Bollinger Bands starts with evaluating the width of the Bands. This is done using the Band Width Indicator (BWI), which is calculated as follows:
BWI = ( UB - LB ) / MB
Where UB is the Upper Band, LB is the Lower Band, and MB is the Middle Band.
Using...
Achieving success in trading requires avoiding numerous pitfalls as much, or more, than it does seeking out and executing winning trades. In fact, most professional traders will tell you that it's not any specific trading methodologies that make traders successful, but instead it's the overall rules to which those traders strictly adhere that keep them "in the game" long enough to achieve success. Following are 10 of the more prevalent mistakes traders make.
This list is in no particular order of importance.
1. Failure to have a trading plan in place before a trade is executed.
A trader with no specific plan of action in place upon entry into a trade does not know, among other things, when or where he or she will exit the trade, or...
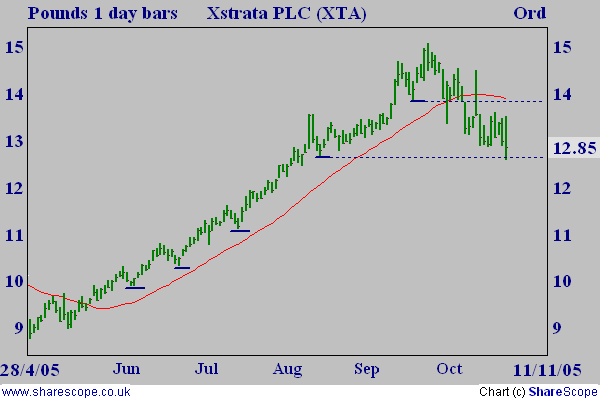
Take a look at the nice up-trend on the chart below. There are plenty of reasons to have entered around £10 and sat comfortably in your armchair until some warning signs and an exit around £14, or even higher. A 40% rise and an easy 400 or so points - easy in hindsight that is. We can't trade hindsight, of course, but a simple swing trading technique would have served you well in real time.
Good trends like this develop by taking a run forward followed by a few paces back (retracement) followed by another run forward and a few paces back and so on. Simple swing trading seeks to take advantage of trend continuations by identifying those significant retracements in order to provide points of entry and a level of exit for ongoing...
Those who haven't worked in the industry may not be aware that nowadays most investment bank traders will only trade one particular sector or cross rate or country. This has not necessarily always been the case. When I first started in the industry as an 18 year old trading Japanese warrants in 1989 all the banks involved in that market divided their trading books into alphabetical order. For example, I traded all warrants whose company names were from S to Z such as Sumitomo Chemical and Toyota. While this arrangement had seemed to work during the bull market years, it was only when the market got tougher during the crash years that banks realised that it would be far better to divide the trading books by sector as there was no...
This article is a basic introduction to the fixed income market. It covers the primary facets and features of fixed income as they relate to trading from the individual, as opposed to institutional, perspective.
The term "fixed income" is used to describe a collection of
securities which have predefined pay-out terms. An example would be a certificate of deposit (CD) in which one deposits a set amount of money and in return receives a given amount of money, which includes both the original deposit plus
interest income, at some future date, known as the maturity. Fixed income securities, unlike
stocks, are based on loans. While one might think of "buying" a CD, what he/she is in fact doing is loaning the bank money, for which they...
Limitations in usefulness of conventional standard deviation bands as overbought/oversold benchmarks
One of the popular ways of detecting a trend in financial market time series corrupted by random fluctuations (noise) is moving average smoothing. Actual prices fluctuate around the moving average. To measure an average distance of price values from the moving average the standard deviation (SD) can be used. The so-called in statistics "range rule of thumb" determines the range of price variability around the moving average as approximately 4SD, providing confidence limit of about 95.5 %. According to the rule, the upper boundary of the range will be about 2SD above the moving average and the lower boundary of the range will be about...
A chess player analyzing the board for the next move; fighter pilots maneuvering their planes to get a lock on enemy aircraft; a baseball player tracking the release of the ball from the pitcher's arm; ballet dancers executing their leaps; an oncologist diagnosing a rare form of cancer; a bodybuilder sculpting a small muscle group to achieve symmetry: all of these are examples of performance activities. They are also examples of fields that have been widely researched in the past two decades, uncovering important clues as to the factors that create successful performance.
This research raises fascinating questions: What makes expert performers different from less successful ones? Is expert performance a function of inherited...
Looking at all of the glossy ads promoting analysis software, educational courses, seminars, workshops, newsletters, past gurus, new gurus, astrologers etc. you could be forgiven for thinking that taking profits out of markets is simply about something called 'forecasting'...
All you need to do, apparently, is pay your money and you too can forecast with such amazing accuracy that you'll be able to trade on the hoof for just an hour a day as you travel from beach resort to, er...beach resort. Yes, it's really you on the lounger by the pool in that promo!
Strangely enough, trading is not like that. Professional traders have nothing but disdain for the hype and misinformation peddled largely by those catering to the masses of private...
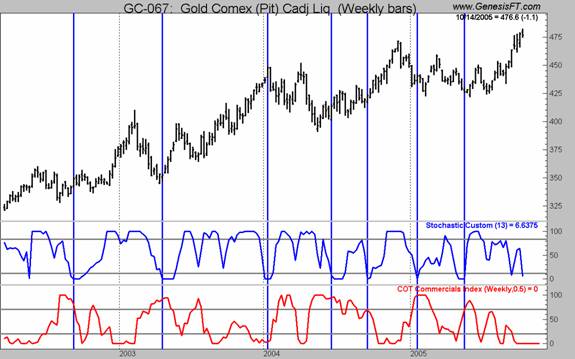
Open interest is without a doubt the least used bit of market data by chart watchers. Conventional wisdom; prices up on increasing O.I. being bullish, is just as often found to be bearish.
What I want to show here is the relationship of O.I. and the buying patterns of the Commercials for the Commitment of Traders (COT) report.
I'll begin by showing a chart of gold with an indicator I'm sure you have never seen before, a 13 week stochastics of just Open Interest. Yes, this index is simply an oscillator of O.I. What we see is that, generally speaking, low levels in this index are found at market bottoms.
Thinking about it makes sense as what it is telling us is there is little interest, open or not, in the market we are studying. I...
For many years I was a futures market reporter with the FWN wire service (now called OsterDowJones). I spent time working right on the futures trading floors in Chicago and New York. Most of the time my daily reporting "beat" involved interviewing traders and analysts and then writing three daily market reports. For months at a time I would cover the same markets, day in and day out. It was a fantastic learning experience and an opportunity that very few get.
One thing I eventually discovered from covering the same markets day after day, month after month, was that the vast majority of the time the vast majority of the markets' overall fundamental and technical situations did not change on a day-to-day basis. Yet, as a market reporter...
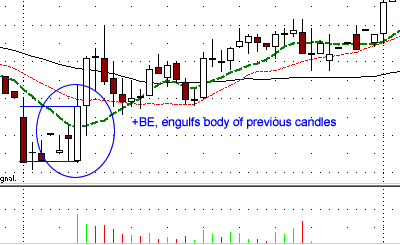
Candlestick Charting
Candlestick charting originates from Japan, where it was used from the 17th century to examine patterns in the price of rice. Candlestick charting has come a long way since then and is now part of the mainstream technical analysis toolkit. Reading candlesticks is an attempt to understand the collective emotions that drive the financial markets every day.
Candlesticks are formed using the open, high, low and close of a stock or other security. If the close is above the open, then a hollow candlestick (an up day) is drawn. If the close is below the open, then a filled candlestick (a down day) is drawn.
The hollow or filled portion of the candlestick is called the body (also referred to as the "real body"). The...
Perhaps the greatest luxury I have in this business is the ability to observe the experiences of many traders with different personalities, life schedules and risk capital, each trading in a variety of markets. What most astute brokers realize is that, over time, as some individuals prematurely exit winners while others desperately cling to losers, it becomes quite possible to match different "blood types" of those traders with their correct "trading diets." Clearly, we're not talking the medical blood type here, but in the figurative sense it makes the right point. With practice, it's not too hard to determine blood types (type of trading best suited to the individual) based on the personality of the trader, and then prescribe a diet...
In 1969, when I made my first futures trade, thinking was fashionable. The 1960s and 1970s were good times for thinkers, free thinkers, thought-provoking issues, civil disobedience, and analytical traders. Thinkers thought great thoughts about the future of our nation, about our presence and purpose (if any) in Viet Nam, about domestic and international racial issues, about freedom and equality, about the poor and the homeless. Thinking prompted radical action by various political interest groups. There violent numerous anti-war protests, a variety civil disobedience events, draft card burnings, sit-ins and student protests. The stock and futures markets were studied closely. They were analyzed, scrutinized and theorized...
Many times in the past I've written about the need to adapt, the need to be able to change your behavior relative to the market because the markets are ever changing.
I've stated that mechanical systems may be workable, but for only a short time relative to the life of markets. You must learn to trade what you see and to understand what you see on a chart.
When I first began trading there was no such things as futures contracts for foreign currencies. Why didn't they exist? Because there was no need for them! In the 1970s all that changed when the US Dollar went off the gold standard and began to float against other currencies. Following that, the Chicago Mercantile Exchange began to create currency futures to provide a place...
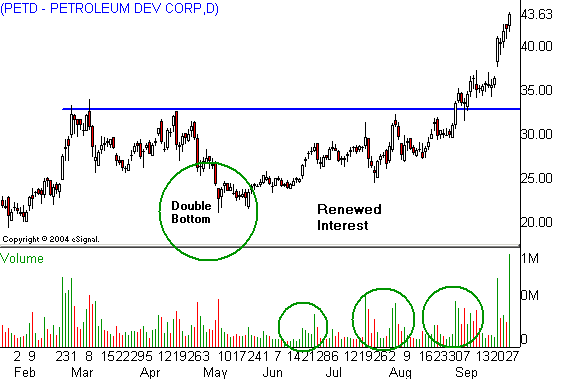
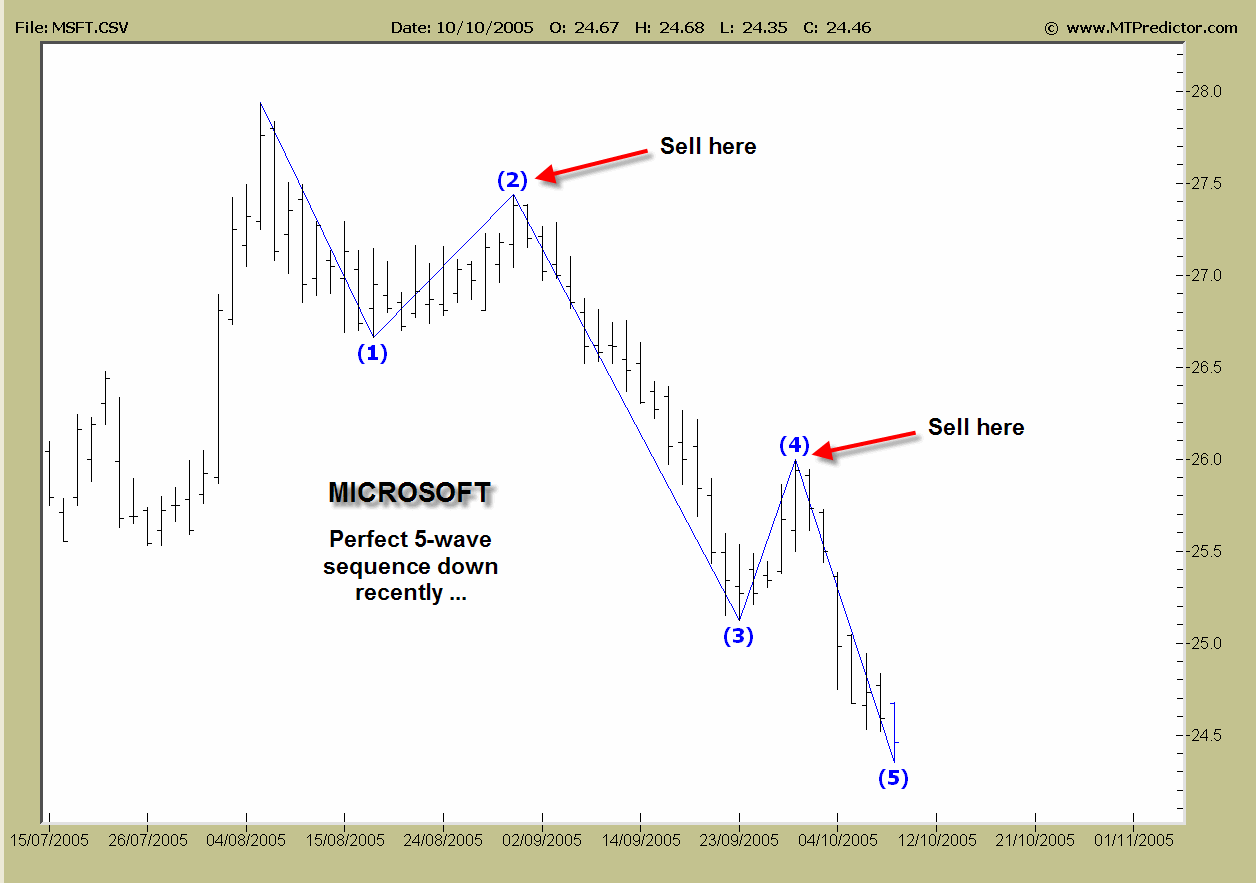
Chart patterns capture the development of crowd emotion and provide potentially high
probability trade ideas with well-defined price targets and exact measures of risk
management. But patterns - by themselves - do not necessarily lead to consistent outcomes. The development of chart patterns only alerts traders that one particular type outcome is more likely to occur than another. As price moves towards a selected price point, the trader pays more attention to the stock, ready to place a buy order if prices move a few ticks above that level. In other words, chart patterns signal that trading potential and the probability to take action may exist.
Chart patterns are an invaluable aid to trading, but only when they point the way to high...
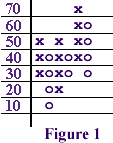
There are a large number of traders who look at Point & Figure charts, with "look" being the operative word. That is, for most traders, once the market data gets represented as a P&F chart, they are at the end game. If the last x entered is in one box higher than x's in other columns, you've got a "buy signal".
Why is that so? Because someone eons ago said so. What's the proof? There is none; that's just the way it is. Now, don't go thinking that I am going to trash P&F. Au contraire. I'm going to show you why it's a great tool, how to test its efficacy and use it more effectively.
Before I really get started, let me explain that not everyone considers P&F charts as something only to look at. One extremely respected investment...
There are many ways to trade, but I like combining some fundamental, knowledge or perhaps some news, an understanding of technical analysis, a grasp of how markets behave and the ability to read sentiment as demonstrated in price action, buy/sell pressures and the actual trades printing off - the deals being done.
This may sound a little involved but is actually quite easy with a little knowledge, common sense and reading the market.
On September 1st I made a list of those stocks that were already benefiting from buying interest, (or selling pressure like some insurers), in the wake of the devastating Hurricane Katrina. Building material stocks, alternative energy stocks, insurers, specialist manufacturers of rescue products were of...
What is gamma?
An option's price changes with fluctuations in several factors such as spot price, volatility, interest rates and time. Delta is a measure of the change in option premium with respect to a change in the underlying, or spot, price. Gamma represents the change in delta for a given change in the spot rate.
In trading terms, players become long gamma when they buy standard puts or calls, and short gamma when they sell them. When commentators speak of the entire market being long or short gamma, they usually are referring to market-makers in the interbank market.
How market makers view gamma
Let's consider how market makers view gamma. Generally, options market makers seek to be delta-neutral - that is, they want to...
Do you have trouble pulling the trigger? If so, you're not alone. Greed and fear exert a powerful influence when the time comes to enter the trade. This is especially true for newbies who have great difficulty visualizing the rewards or risks they're about to incur.
Effective trade entry requires skill, confidence and a strong stomach. Most of the time it should be an uncomfortable experience; no one likes to lose money. But the ability to follow a disciplined entry plan, even when it hurts, separates profitable traders from the hordes of losers who take up the game.
I receive dozens of questions each year from frustrated traders who aren't sure when to be in or out of positions. I've compiled the best ones here today, along with...
The Percent Range (%R) technical indicator was developed by renowned futures author and trader Larry Williams. This system attempts to measure overbought and oversold market conditions. The %R always falls between a value of 100 and 0. There are two horizontal lines in the study that represent the 20% and 80% overbought and oversold levels.
In his original work, Williams' method focused on 10 trading days to determine a market's trading range. Once the 10-day trading range was determined, he calculated where the current day's closing price fell within that range.
The %R study is similar to the Stochastic indicator, except that the Stochastic has internal smoothing and that the %R is plotted on an upside-down scale, with 0 at the top...
What do we do now? The "Bubble" burst, Single Stock Futures, Pairs Trading, Automation, New Platforms and Access. Professional traders are adapting to the new climate.
I'm often asked what traits are common in a successful stock trader, and although there are many, the single thing that I find binds us all together is "adaptability"...plain and simple. We all thrived through the euphoria of the DOTCOM phase, and the NASDAQ meteoric rise through common sense into obscenity. Many a genius was behind a computer when the "buy and hold" mentality permeated the shell of proprietary trading. Swing trading was born from the attitude that "it's gonna go back up, wait and see!" TV and Online Brokers found gigantic audiences in the new...
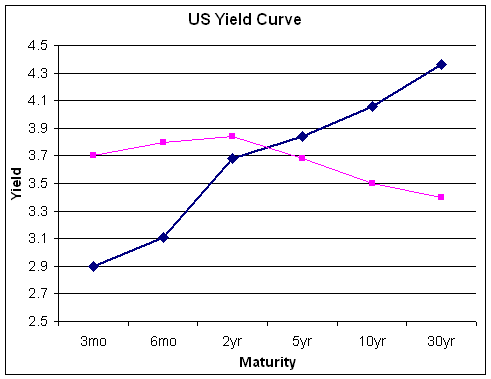
The current account (CA) represents the sum of goods and services balances, income, and unilateral transfers
Studies show that industrialized countries running a current account deficit in excess of 5% of GDP will undergo exchange rate and/or price adjustment; currently the US CA deficit is hovering 6%.
In light of the market's overall focus on the sizable US current account deficit, the following note defines and explains the balance and its components.
What is the current account?
The current account measures a country's international transactions, and includes four main components:
Goods: Physical objects whose ownership is transferred across borders. Goods include both general merchandise (retail goods) and capital goods (i.e...
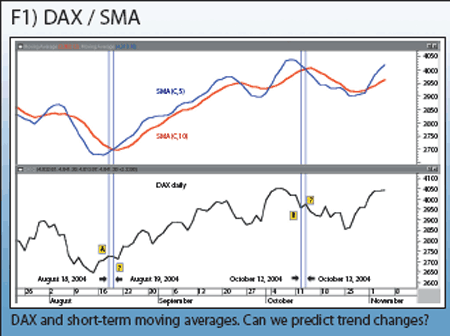
Moving averages and their crossovers or crossovers with indicators are widely used in trading and
technical analysis. Shorter averages above longer averages or closing prices above them suggest an uptrend. An indicator below its moving average is a sign of a downtrend. It would be beneficial for a
trader to develop a technique to predict the closing price which will generate a crossover of averages as described above. This article introduces such an anticipation technique, based on moving averages, to determine the future closing price for which a
trend change is possible.
Let's look at figure 1 representing the German
DAX index. Subchart 1 contains two simple moving averages: 5- and 10-day, SMA5 and SMA10. It is well-known among...
In my last article, I covered some of the pitfalls of trading journals. In this piece I'd like to cover some of the features of trading journals that I have found helpful in my work with new and experienced professional traders. My goal as a trading psychologist is to do all that I can to accelerate traders' learning curves. Sometimes this means helping traders with emotional problems, but just as often such problems are the result of trading difficulties and not their cause. A journal, properly constructed, is a powerful tool for learning - and relearning - markets and cultivating exemplary trading behaviors. Here are some of the principals that have guided my journal-based work with traders:
Make journals a part of the daily...
The following is an interview of Michael Covel by Trade2Win Content Editor John Forman. Michael is the author of the highly regarded book Trend Following, which makes a very strong case for the value of trend trading methods.
At the very beginning of your book you differentiate between traders and investors. Why is trading better than investing?
Thinking like a trader is the only way to profit in today's markets.
Investors buy and hold. Hoping that the market will continually move up, they buy long with no exit plan. They do not manage risk so they give up control. Traders, on the other hand, do not care whether the market goes up or down. They buy long or sell short and they always have an exit plan. They have predefined exit...
Numerous discussions of paper trading, and its value as a learning tool, usually see participants divided into two camps. One claims total uselessness of paper trading, another vows never to start without it. The scoffing camp points out the obvious limitations of paper trading:
It doesn't allow you to estimate slippage during your execution.
It leaves unanswered the question of whether your order has a chance to be executed at all.
It keeps you in a relatively relaxed state of mind as there is no pressure of endangering real money.
It also doesn't allow you to master your order routing tools in full.
Finally, it's very easy to cheat oneself, changing one's decision after the fact and booking corrected results.
Is this all true...
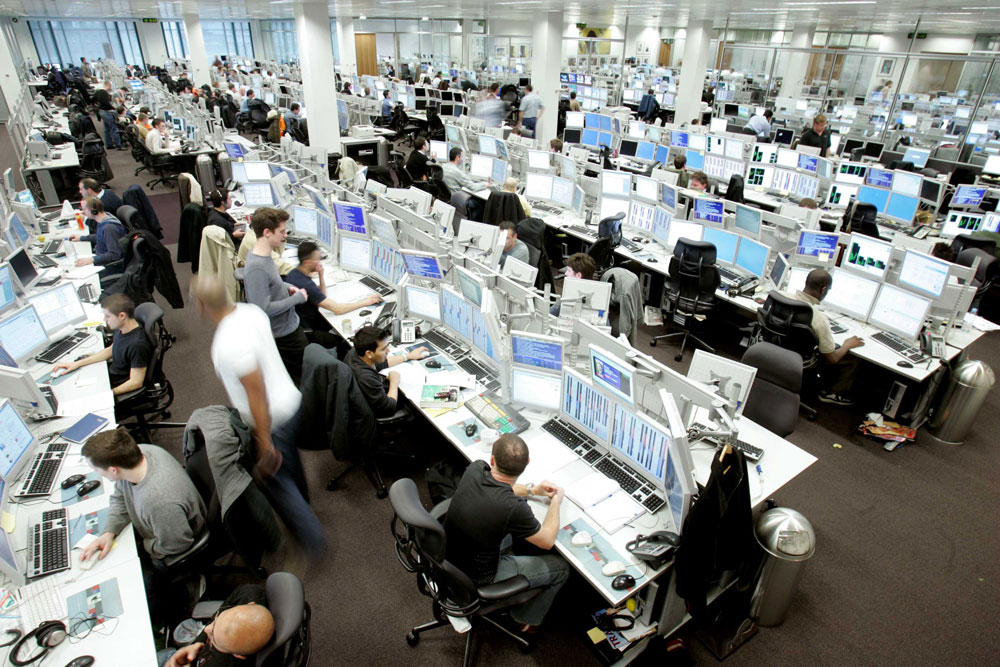
What is a trading arcade?
A trading arcade, proprietary trading group or trading bureaux are some of the commonly heard names for a company that provides risk management, additional leverage, professional software and hardware infrastructure, trading facilities with analyst support and sometimes training and capital backing to traders in return for a share of trading profits and/or commissions.
At an arcade, you would typically find a spacious trading room filled with desks: well equipped work area's with high spec workstations, arrays of screens and terminals providing access to market data & depth, quotes, charting, Reuters, Bloomberg, Sky TV and the all important trade execution platform. The name trading arcade probably originates...