You are using an out of date browser. It may not display this or other websites correctly.
You should upgrade or use an alternative browser.
You should upgrade or use an alternative browser.
Articles
Filters
Show only:
Loading…
A look a the current market correction - the 'canary correction' and what may have caused it.
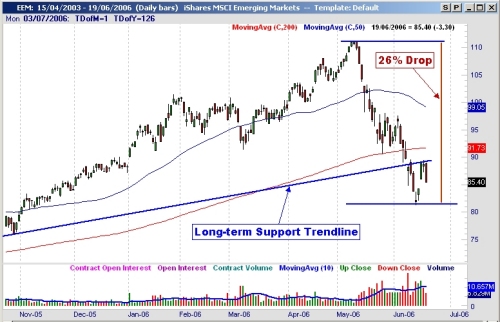
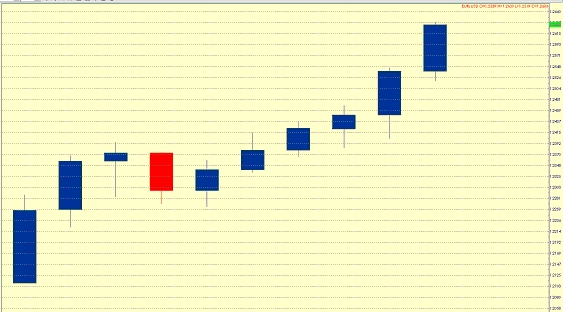
When the Morgan Stanley Emerging Markets Index Exchange Traded Fund (EEM) hit an all-time high of $111.10 on May 9, 2006, it marked a meteoric rise from its humble launch price of $33.37 a little more than three years before. Volume had also grown exponentially from a mere 36,300 shares on April 11, 2003, to an average daily exchange of more than 3.5 million shares by early May 2006.
caption: Figure 1 - The Morgan Stanley MSCI Emerging Market ETF (EEM) dropped sharply between May 9 and June 13, 2006. May registered the biggest monthly decline in the history of the index, and the drop was only half over.
Chart provided by www.Genesisft.com...
Introduction -
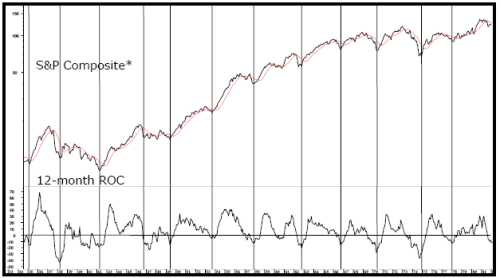
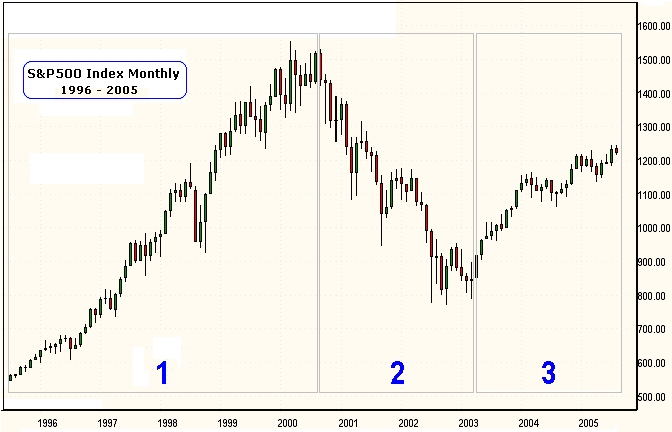
There are occurrences in the business cycle when the consensus of my proprietary primary trend indicators find themselves within the confines of the bearish camp. Unfortunately, now seems to be one of those occasions. The last time the technical, economic, and monetary indicators aligned themselves in such a negative way was the turn of the millennium. Then, as now, for the benefit of my subscribers, and their valued clients and investments, I feel duty-bound to publish a Special Report setting out the arguments for the impending scene about to unfold.
In early 2000 it like the market was at, or close to, a secular or very long-term peak (albeit if not in absolute price terms, certainly in inflation-adjusted ones)...
The second part of the article on Covered Call Writing looks at more detail and gives some examples.
Everybody screws up. It's human nature. I spent the last article explaining what TO do - and what NOT to do - when using the covered call strategy. Did it sink in? I hope so.
Studies have shown that you have to be exposed to something a minimum of seven times before you comprehend it. So, read on. You may think you already understand what I'm about to explain, however, it's more likely (if you're relatively new to options) that you may be a little fuzzy on the subject.
Due to the seeming simplicity of trading covered calls, dozens of books have covered the topic. They devote chapters upon chapters painting blue sky with potential...
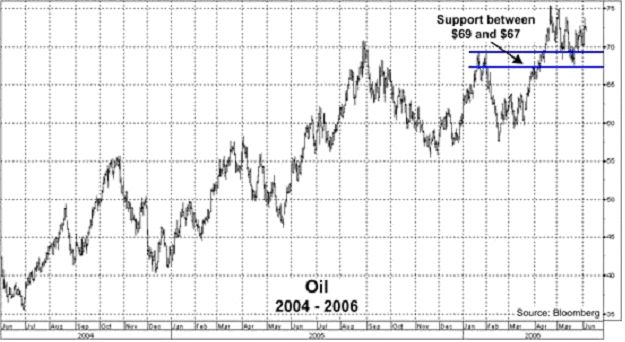
A look at why we might not yet have seen the top of the oil price rise.
The above quote came from one of our companies earliest reports, published on 16 January 2001. The simple equation of supply and demand was the basis for our bullish view and remains so today. Demand is increasing every year, while supply is constrained by a lack of past investment, as well as the absence of any sizable new discoveries.
Five years on from our bullish prognosis, energy prices remain at the forefront of financial headlines. While oil has displayed significant volatility during the ascent to all-time highs above US$70 a barrel, we remain resolutely bullish about the direction of prices over the longer term.
The case for a high oil price is as...
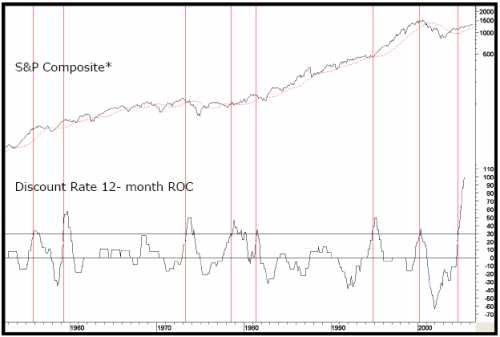
A look at the yield curve and why it is said to be the most accurate forecast of looming recession.
I have written about the yield curve more than any other single topic in the almost six years of writing. There is a justifiable reason to pay attention to the yield curve. In certain very specific circumstances, it has been the single most reliable predictor of recessions. Let's examine what those circumstances are.
First, the yield curve is a graphic depiction of the relationship between the yield on bonds of the same credit quality but different maturities. Normally, you expect to get more interest paid to you for holding a longer maturity, as in theory there is more risk to holding a bond for ten years than for 90 days, or for 30...
The first of a two part look at Covered Call Writing. In this first part, we start with the basics.
When you embark upon your first adventure into options trading, there are those who will tell you that "covered call writing" is the safest strategy. Even brokerage firms allow novice option traders to trade covered calls in their IRA accounts. Little do they know. Or, if they really do know, little do they care.
Once upon a time there was an investor. All of his life he was taught that, if you buy a stock and hold onto it forever, the stock will go up, you make a lot of money and live happily ever after. It's the American dream. As we've come to learn, those dreams and Mother Goose have a lot in common. They're fairytales. The harsh...
Candlestick charts are widely used by traders around the world, as superficial demarcations between East and West are thankfully fading away. While bar charts are still more popular because of sheer inertia, there is little doubt that candles provide much more information, even though both types of charts are based on the same prices. Let's take a look at the advantages of using candles when gauging the validity of intersections.
Traders make a big deal about prices breaking support and resistance lines, trendlines, moving averages and retracement or extension levels. However, intersecting these lines on an intraday basis and closing outside them are two very different ball games.
Benefits for Using Candlesticks
Let's quickly...
In this streaming video, Bo looks at breakout's from support and resistance levels.
In this example, he demonstrates a simple break-out strategy on IBM pair using a 30 minute chart.
Click here to view the video (will appear in new window).
As a Short-term trader do you ever look at longer term time frames? If not, then this article will explain why the longer term time frames can influence the shorter intraday ones.
Most independent Short-term Traders tend to ignore the Long-Term technical condition of the Market because they believe it is not important in their trading. Few things are further from the truth, that is, if you want to survive the market over a long period of time, and still be trading years, even decades from now.
In the same manner that the tides can raise or sink all ships, the larger trends, behavior and technical design of the markets greatly affects ALL independent traders, regardless of trading style. You can have an independent short-term trader...
An initial article giving a brief opening look at the psychology around trading.
After many long hours, you have completed a system that you have incorporated into your trader's business plan. Your money management strategy is within the bounds of your comfort range and you start to trade following your system's rules. Despite the fact that you have completed all of this work, you find that you are still losing money while your system is showing that you should be making money. This is when you discover the importance of the Psychology of Trading. Or do you?
At this point, most traders maintain the status quo and refuse to admit that a psychological issue might be holding them back from following their rules. Those traders who are...
A brief look at three important principles that no trader should overlook, if they intend to be successful.
It is a given that traders cannot win 100 percent of the time, because with reward comes risk, and losses are as much a fact of life as taxes and death. But there are highly valuable lessons to be learned about the trading process that go far beyond the dollar signs. How traders put reliable steps in place to ensure that their performance may be enhanced on the road to success is critical. For most success is dependent not only on what is done correctly but also on what potentially havoc-wreaking mistakes can be avoided and/or corrected.
There are three principles that can aid in anticipating and possibly avoiding mistakes, they...
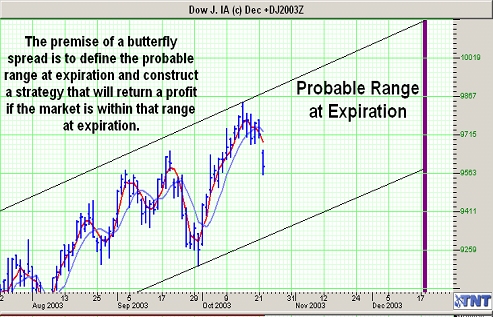
Stock indices futures are known for their volatility, however trading index options may be a more manageable alternative for the average trader.
Highly leveraged futures contracts are available in all of the major indices. Perhaps the most popular being the Dow, Nasdaq and S&P 500. Similar to mutual funds, trading indices offer stock traders instant diversity. Traders can profit from an increase or decrease in the overall equity market as opposed to trying to pick individual stocks.
However, the volatility and leverage involved with stock index futures prove to be unmanageable for many traders. For this reason, traders may find that options are the ideal instrument for index trading.
Range Trading
Because the stock market can be...
Is trading just a game of cat and mouse? Do we smaller traders - the mice - get noticed nibbling the cheese (profits) on the mouse traps set by the cats (the major player)?
A Game of Cat and Mouse
In my decades of trading, I've learned many lessons about the market. The chief of these lessons is that I don't know anything about the market; at least, in comparison to the market makers on Wall Street. Think about it. The traders at firms like Goldman Sachs, Merrill Lynch and the like pull down salaries of several million dollars each year. I refuse to believe that they are so richly compensated because they don't know anything. They know a lot! It's their job!
As a result, like many individual investors, I engage daily in a game...
The author of A Complete Guide to Technical Trading Tactics: How to Profit Using Pivot Points, Candlesticks & Other Indicators, looks at a candlestick formation that can indicate reversal points when used with pivot points and support/resistance levels.
There are many trading methods one can employ to actively trade including various mechanical trading systems and manual trading tactics. The constant changing of market conditions can require system traders to adapt and update the parameters for the trading decisions. I often prefer the hands on visual approach which is more of a manual method while employing mechanical risk management techniques. The visual approach is aided by the use of candle charts. The draw back is one must have a...
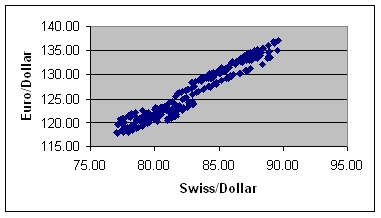
What is the correlation between different FX pairs and how can it be measured?
As a Forex trader, it is necessary to be constantly aware of the characteristics of the currency market. Without knowledge of the basic tendencies of any given currency pair, traders are exposing themselves to excessive amounts of risk. One of the most beneficial pieces of knowledge for a Forex trader to be armed with is the historical correlation between currencies. Understanding this relationship will not only allow traders to hedge positions, but it may also give them an edge when it comes to entering a trade.
The term correlation is used to describe the relationship between two related variables and can be expressed as an integer between +1 and -1...
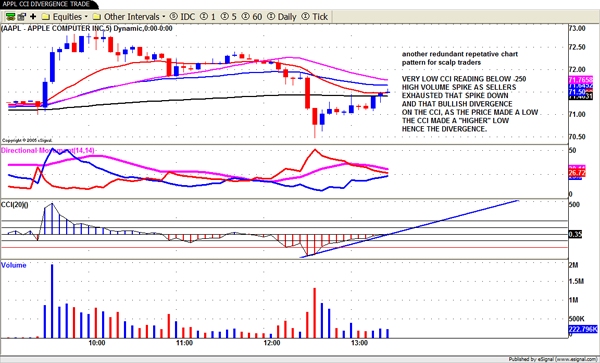
Jerry gives us another of his humourous, educated article on chart patterns using the CCI.
We as traders have been looking for the "Holy Grail" for a lifetime. I doubt there is one folks. But all thru my 65 years on this planet I certainly have tried every known indicator, oscillator, etc to get to that Holy Grail. Well I can tell you all I think I found the Holy part of that statement in the momentum indicator the Commodity Channel Index, CCI for short.
Many traders swear by the Macd, Stoch, Rsi, Obv and on and on. The CCI with a 20 moving average (20) is the best leading momentum indicator I have ever used in my trading life. I will include a series of charts depicting the way I use CCI in the exciting world of daytrading which I do...
Steve gives us an insight into the methods he uses for trading and what his trading day is like
How did it all start? (How did you get into trading?)
When I was in college I discovered that a savings account was a guaranteed loser after inflation for me, and a guaranteed winner for the bank. I was an electrical engineering major and was researching potential places to work when I graduated. I started following several technology companies, and watching their stock prices. I wondered what made good companies and what drove the stock prices so I began reading about investing. I found it interesting and investing became one of my life long passions.
How did you learn to trade? (Are you a self-taught trader or did another trader/mentor...
Dr Doug "The Head Coach" discusses the psychology of trading and the similarities between coaching the top athletes and the top traders.
How did it all start? (How did you get into trader coaching?)
I played baseball my whole life and through college (I was a catcher). When I graduated, I got a job on trading floor for a proprietary trading firm at the Chicago Mercantile Exchange. They used to hire athletes almost exclusively because they believed athlete's made better traders. Anyways, I worked there for a few years and then a herniated disc in my lower back forced me to leave the floor and trade equities electronically. I did that for about 9 months and then realized I wanted more out life so I left the trading world to go coach...
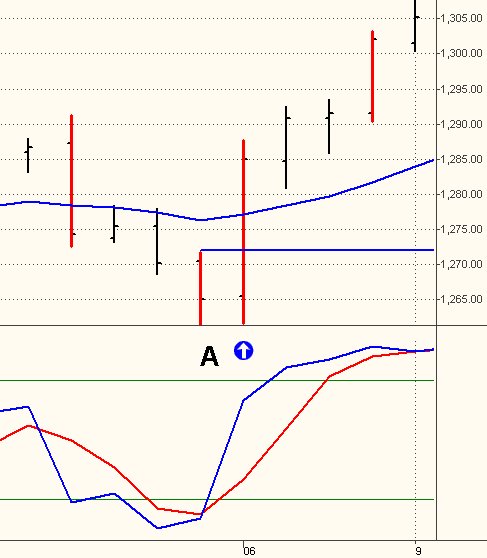
The pattern provides traders with a tool to identify short-term reversal points and assess their potential. It is based on the Market Facilitation Index (MFI), which is the ratio range/volume. This indicator allows you to determine the efficiency with which prices change and the market's ability to move prices. Bill Williams presented the indicator in his book Trading Chaos. The indicator is built comparing changes of the previous bar's value of this index to changes in volume. Using this indicator, it is possible to determine the interest that the market has in the current price trend. You can assess the public involvement in the price action and its influence on price movement.
To assess potential reversal points, the most...
Trader education has become a hot topic in recent years. Everywhere you look there is someone offering some course, seminar, training program, or whatever. Many are very pricey, and we can certainly debate the real value of quite a few. The proliferation of the products and such can't help but bring up some of the commonly debated topics related to whether traders can be taught or just have some innate talent which allows them to succeed. This article makes its own contribution to that discussion.
In the interest of openness, my personal view is that anyone can learn to trade effectively. By that, I mean we are all capable of trading toward a reasonable and rational set of goals and/or objectives determined by our own personal...
So you want to be a day trader huh?, really???, hmmm, well isn’t that special!!!! Think you have what it takes to make a living trading the Markets??? Do ya Bunkie???? I wouldn’t quit my day job pal. In fact unless you’ve done your homework first and foremost, don’t do this until you’ve at least tried it on a part time basis. Otherwise if you try to dive into the abyss without a net, you're doomed right from the get go! Doing it on a part time basis just for the feel of it is fine. Never would work otherwise.
Oh and pardon me for asking, but what makes YOU think you're smart enough, stable enough, and mechanical enough to do this? You read about it in a book right? Seemed kinda easy to ya? Did it? You figured heck this doesn’t seem so...
Implementing sound money management encompasses many techniques and skills intertwined by the trader's judgment. All three of these ingredients must be in place before the trader is said to be using a money management program along with their trading. Failure to implement a good money management program will leave the trader subject to the deadly "risk-of-ruin" exposure leading eventually to a probable equity bust.
Whenever I hear of a trade making a huge killing in the market on a relatively small or average trading account, I know the trader was most likely not implementing sound money management. In cases such as this, the trader more than likely exposed themselves to obscene risk because of an abnormally high "Trade Size." In this...
Breakouts of long bases on strong volume are frequent harbingers of continued price appreciation. Another harbinger, after the initial up-leg, is a low-volume, orderly pullback towards support.
Kendle International (KNDL)
An analysis of Kendle International's chart illustrates this strategy. As the daily chart indicates, Kendle in February 2005 broke out of a base pattern that extended back almost two years. Some traders, who missed entering early, may have given up on the stock when it doubled by late June, but a closer look at the chart shows why it had more room to move.
Kendle's pullbacks were orderly, coming on lower volume and holding near its moving averages, a key sign of more upside to come. Only once did its pullback break...
I get more questions about stop losses than about any other subject. Clearly this strategy causes traders a lot of pain and confusion. Some of it stems from the schizoid nature of our modern markets. But most of it reflects an underlying weakness in trade management skills.
What takes place at the end of a trade usually reflects decisions made at the beginning. In other words, the best entries usually lead to the most profitable exits. This is the most urgent wisdom I can give when it comes to stop-loss placement.
We can spend hours deciding whether a stock is a good buy or a good sell, but this emphasis is often misplaced. Over time, carefully chosen exits are more important than great entries. You don't believe me? Just ask all...
Roger Middleton is an experienced trader who focuses on the equity markets. His insights, however, are applicable to traders of all kinds.
Starting Out
How long have you been trading for?
8 years
How did you first get involved in trading?
I was made redundant in 1992, and was in danger of losing everything, so decided that the ability to generate a second income which no one else could take away once I was back on my feet was a priority. It was what my daughter called my "get out of jail free" card.
Do you remember your first trades?
First trade was Tadpole Technology at 200 (down from over 400). Bought because I thought it couldn't go any lower. Next day it went to 250 and I thought how clever I was. Eventually sold at 180 for a...
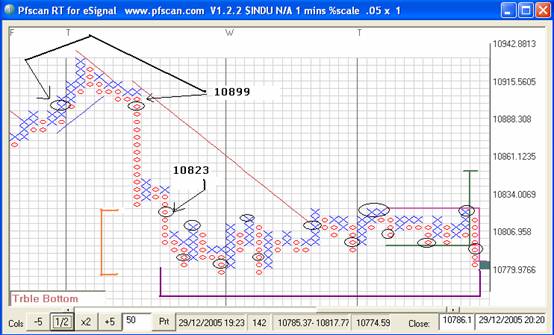
[Editor's note: This article was originally written on the 30th Dec, 2005]
Okay, so make your own title up!
In Part 1 I set out the basic ideas of P&F charting. For anyone who would like to read more on the subject there’s an absolute plethora of material out there – one book I’d thoroughly recommend is ‘Point & Figure Charting - The Complete Guide’ by Dr Carroll D Aby Jr. This book doesn’t waffle, which many do, and it’s the only one I’ve found that highlights variations in the methodology – depending on who you read and where you’ll find some target calculations can be performed several different ways for example.... I consider it a mark of thoroughness that this book considers some alternatives to the ‘tools’ of P&F. I’d add this...
With everything said and written on the subject of stops, it should be given that everyone is conditioned to keep them religiously even before they start trading. No matter what source a newer trader turns to, utter importance of stops will be underlined and emphasized up to the degree that keeping them is heralded as the ultimate key to success. We all heard adages like “Take care of your losses, profits will take care of themselves”.
Do all the stern warnings work? Not really.
Time and again traders blow their stops, widen them in a course of a trade, hold losing position in false hope it will make them whole. If this destructive behavior continues despite all the warnings, there must be deeply rooted reasons for this. As with most...
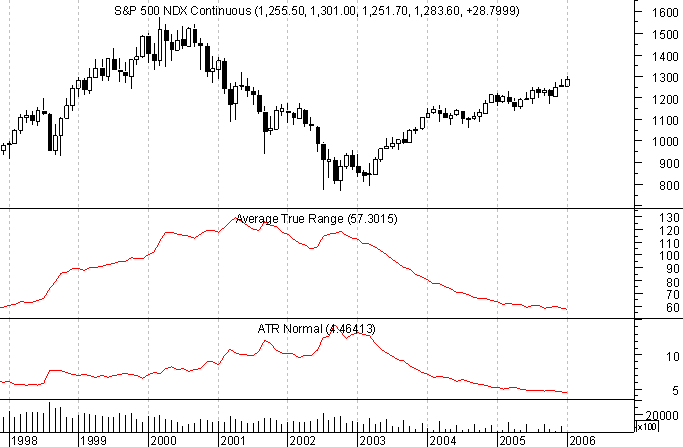
The Average True Range (ATR) indicator is one which falls in the general category of volatility-based technical analysis tools. It is so because like Bollinger Bands, another volatility-based study, it does not focus on direction in any way, but rather how much raw movement there is in price. To understand this a little better, it is worth taking a look at how the indicator is calculated.
ATR Calculation
The ATR calculation starts with determining the True Range (TR). The TR for a given period is defined as being the largest of:
Current Period High minus Current Period Low
Current Period High minus Previous Period Close
Previous Period Close minus Current Period Low
ATR is the average of the True Range (TR) over the past n...
We can spend hours searching for the perfect pattern but fail miserably when its time to turn opportunity into profit. As it turns out, most traders do a poor job managing positions, regardless of experience level.
I've received hundreds of questions about this subject over the years and have complied them into a Q&A to help you make the right choices during the trading day.
Q - What time-frame charts do you use in real-time?
A - I track daily, hourly, and 15-minute charts for all my setups and positions. I don't look any other time frames, except for an occasional glance at the weekly charts. This arrangement doesn't change with liquidity, sector or any other variable. I watch these charts simultaneously on three screens, so I don't...