Xmas Project

twalker said:
Seems from figures as if the week starts at XXX
At this point sell Thursday open buy back on close. If Thursday is also X buy Friday open.
Is it really that simple?

twalker

According to the study (covering S&P 500 from 1976 to 1985) if the week starts XXX then there is 62% probability of a reverse on Thursday (XXXO) and a 38% probability of continuation (XXXX). Then for Friday, if XXXO then a 52% probability of reversal (XXXOX) and 48% continuation (XXXOO) OR if XXXX then 62% for continuation (XXXXX) and 38% reversal (XXXXO).

So, if these probabilities still hold good some 20 years later, it would be that simple in terms of direction. Whether it's tradeable or not depends on the degree of movement in the desired direction and that's not made clear.

Just came across it in Kaufman - haven't tested it at all.

jon
 
ah, you guys have been busy over the weekend!

currently suffering with a sore arm from an excess of snooker and playstation, but i will soldier on.

TW, the rules as far as i have got are :

fade the direction of the previous 4 days (FTSE parameters. Dow and SP work best with 2 days IIRC. dax isnt worth bothering with on this one). trading on the close of the cash index.

hold multiple positions and close off on the first trading day of the next month. and start all over again.

theoretically the max exposure is 20 or so positions, but that implies on the market moving in the same direction all month. dont think this has happened over the past 6 years.

i'll look into coding open equity and capital requirements in due course. on the back burner for a while though.

ta,


Barjon, i'll look into coding some weekly patterns into excel and report back my findings.

reckon it could be a goer. 62% is enough of an edge,

FC
 
JonnyT said:
Well I'm coming to Orlando in the spring.

Do you want me to kill you whilst I'm there?

Perhaps I could drown you Typhoon Lagoon or maybe throw you to the Gators or Crocs in the Everglades ;o)

JonnyT
Your choice, now start talking buddy !
 
ok, time to test sharky's profanisaurus.....

**** **** ******** Todmorden w**k **** fishing *******


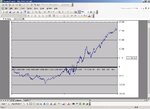
had a bit more testing on the orignal idea of settling on a monthly basis..

as you can see, the equity curve looks all over the shop... the last 2000 trading days look generally ok. but before then, it looks a bit suspect.

clearly volalitity is important here.

so the question arises, not just of this system, but of most systems in general....

is the recent increase in volatility of 1997 onwards here to stay? 7 years is a sustained rise, or is it going to tail off and return to longer term levels??

when trading and designing a mechanical method, should we pay more attention to recent data , or should we look at the whole picture?

is the advent of electronic trading (and therefore volume/volatility) responsible for the recent success of most counter-trend systems? will it continue?


knapsack.

FC
 

Attachments

  • longer term.jpg
    longer term.jpg
    91.8 KB · Views: 300
trendie said:
It is a good idea, but will get bogged down in pedantics !!

I tried something similar on the Fib thread. I wanted traders to apply their advice, and different takes on a single style, Fibonacci, and to arrive at a consensus trade.
( My idea was that some traders may be very good at entry, but have loose exit strategy, and make mediocre money. Then some are not good at entry, but seem to have a good exit strat. By combining the consensus good entries with the consensus exits, we could arrive at a system that is the amalgam of everyones good ideas. It trailed off at some point, never to be heard of again ).

)

trendie...
Maybe a rummage around "Ibw111's " favourite board might be handy for fib stuff... ;) ;)))))
 
Last edited:
The problem with amalgams or collaborative efforts is they tend toward the mean...

...and you (we?) want to be the OTHER side of that....
 
Hey Tony,

I've turned on and found all the latest postson my screen bar one are by The Bramble - you goin' for a record --- come on get that last gap filled.

regards

jon
 
BINGO :idea: :idea: :idea: :idea:

The screen's all The Bramble. Like turning on in a bull run and seeing it awash with blue.

There must be a T Shirt in the post for the fastest posting finger in the land :LOL:

jon
 
Fettered, markets do change dynamics and behaviour regularly so I think it would be difficult to find a system with fixed parameters that consistently performed. Although it gives us a lot of comfort when we see a trading system with an equity curve continually going up, its a false sense of security. I've developed some systems previously that were profitable for 10 years. But if I had jumped on that system full steam ahead feeling giddy with excitement at all that profit, I would have been disappointed as it went flat or slightly went down after that, and that was with a portfolio of stock.

Looking at your equity chart, whose to say that it wont suddenly start behaving like it did early on in its trading history as soon as you jump on it? But I think that markets, even though they do change regularly, keep a certain behaviour characteristic for at least a few years. So it might be worth just designing a system that has been working for the last few years, or add in dynamic aspects to it so that the system adjusts according to the change in behaviour.

We've got to play the odds and an equity curve with the most recent years showing a good profit and the worst years showing a sideways whipsaw, is the best you can do. I would consider trading a system with an equity like that, as unless I've got a time machine it doesn't matter about the early history.

One technique that I was considering recently to help keep us out of trouble, is to apply indicators to the equity curve. If your equity curve starts to show signs of changing trend, get out of that system and design another! On a good up trend a reasonably long period moving average will not be broken by the equity line, and would be an excellent early warning before you even start flat lining, or worse going down hill!
 
thanks pk. i have given some thought to a 200-500 period MA of the equity curve. i guess it is one of the best ways to keep out of a system when it is starting to go the wrong way...

i wonder if it is possible to trade breakouts on equity curves?? reverse the rules on a break down?

or is that just getting complicated lol :)

i guess all we can do is incorporate a trend following element to improve robustness..

now is anyone willing to share a robust,simple trend following method that can be used on EOD, and doesnt involve MA's and only uses the previous few days action to generate signals.

if anyone mentions the turtles i might not be responsible for my actions...

(raphael was always my fave)

:)
 
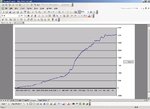
hmm, much as it pains me, here is an intraday trend following method. i never thought i would see the day......

works pretty well over the past few years.

ok, tested on cash data etc, but seems to be about 10pts per day long term..

only problem is the flat equity curve recently....

must.....try.....harder.......

unnngggg :mad:
 

Attachments

  • trend following.jpg
    trend following.jpg
    83.9 KB · Views: 233
I thought the turtles system was meant to be good.
No MA's for trend following? Dont ask for much do you? What about the directional system then, that doesn't use MAs and is meant to be pretty good.
 
directional system? care to divulge the rules?

turtles is ok if you have an absolultely gihungous trading capital. also it isnt much good if you are wanting to has a swift turnover of profit. trades can last for months. and if you need your money to , lets say, eat , then you are running the risk of counting your chips before i can mix my metaphors fully..
 
Not a bad curve!

What about if we took the concept of 'trading' the equity curve a bit further. Go with the system and put a 'stop loss' at the 35000 mark. Then after/if the trend up on the equity curve continues use a long term EMA to give you early warnings of another flat line.
 
The directional system, aka ADX.
A trend-following method developed by J.Welles Wilder. I've got the calculations and stuff if you want them.
 
ah right, the +/- DMI stuff?

if you could pm me the codes i could have a wee look at them.

Wilder has a lot to answer for..

RSI? pah.

though buying on RSI 80 and selling on RSI 20 seems to work ok on forex.

funny how going counter-herd works eh? :)
 
bah.. the calculations and stuff is a bit convaluted. I'll see if I can scan them in for you instead of writing them.

Nothing wrong with taking a walk on the 'Wilder' side :)
 
Top