Xmas Project

da rulez......


right, same as before. Fade the direction of the last 4 days:-

if the last 4 days have been bullish, go short, if they have been bearish, go long.


now the exit is where things get interesting. (and bizarrely simple)

at the end of each 2 month period, close off all trades from the previous 2 months, and then start again from a flat position, buying low and selling high, and close off after another two months.


the attached spreadsheet will probably make things clearer....

during january and february we buy and sell at the close depending on the previous 4 days action. when we hit 1st of March, we close off any open positions so we end up flat. then for march and april we do the same, buying and selling each day. then closing off on 1st May.

repeat ad nauseam.


at the most this can end up with 40 positions open at one point (unlikely!) which is why you may need a sizeable coconut to trade this without the drawdowns becoming lairy.

in terms of simplicity, this does take the biscuit, and its not a garribaldi.


if someone can point out any obvious flaws, i would appreciate it.

ps, i havent tried any other "settlement dates" as i cant work out how to code the thing in excel. dont see it affecting things too much. i tried not having settlement dates at all, and that would have returned about 80,000 points, but is currently in drawdown, and also the equity curve was diabolique..

its getting silly now, the next thing is for me to start recommending Buy and Hold:-

on the 1st january each year, buy the 5 highest yielding stocks of the Dow 30 zzzzzzzzzzzz
 

Attachments

  • astonishing.xls
    944.5 KB · Views: 446
there is a reason for that......

pain in the arris trying to code it sensibly in excel, so had to take a bit of a shortcut.

the equity curve kinda represents unrealised profits until we hit each settlement period.


you are a wet blanket today Brambs :)
 
right, been playing again.

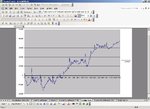
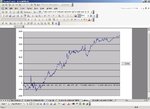
exactly the same entry criteria, and without using stops at the moment (just wanting to test the basic premise) seems to yield profitable results on all the indices that i have data for. Dow (37,000 pts)and SP500 (7385 BIG points) work pretty well, and im sure that using stops could improve things with regard to smoothing the equity curve.

other indices are all over the shop to a worrying degree. something funny must have happened in 1998/1999 that caused all sorts of fun and games..


fundamentally sound. but unless you are gonna stick to the big 3 indices, untradeable.

more tinkering required....

perhaps it works best on the less volatile instruments. might have a go on FX in a bit....

FC
 

Attachments

  • dow.jpg
    dow.jpg
    90.5 KB · Views: 275
  • sp500.jpg
    sp500.jpg
    94.1 KB · Views: 272
Ha! hilarious..

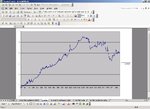
45,000 pips sweet as you like until jan 2002. tum-te-tum=te-tum.

then whabbam. off the cliff thorburn without warning.


so, at least i have established it doesnt like trendy markets.

perhaps why the FTSE behaves so nicely....


ok, who has got any bonds data they are willing to share?
 

Attachments

  • cable.jpg
    cable.jpg
    87.6 KB · Views: 248
stating the obvious:

If your system is profitable during rangey markets, and not so during trends, would ADX ( trend-indicator )as an indicator help to keep you in/out of the market at the appropriate times ?
 
precisely, mon brave :)

though....since indicators arent always reliable, then it might be more worthwhile to combine the counter-trend with a trend-following elephant that should smooth things out nicely...


back to the coalface...
 
Fettered comes out with a terrible rash when in contact with indicators trendie. Must be awful driving around, all those yellow flashing lights blinking on and off. Unreliable too.. once this chap indicated that he was going left and he didn't at all!!
 
pkfryer said:
Fettered comes out with a terrible rash when in contact with indicators trendie. Must be awful driving around, all those yellow flashing lights blinking on and off. Unreliable too.. once this chap indicated that he was going left and he didn't at all!!

I dont really like indicators too much either - except my fave SMAs.
I prefer patterns such as NR7, Dojis as indicators ( !! ) to be more aware of the coming events.
( swing-highs, reversal days, etc )

As far as I know, these may be difficult to code, as FC is doing.
FC may not want to trawl through the 2-years data manually !!

Whereas, other indicators may be easier to code, and see whether certain ideas are worth pursuing.

Sorry FC, hope the "i" word didnt upset you too much.
 
I dont mind indicators at all, infact I regard them in the same way as a highlighter pen. You can see all there is to see by just looking at the HLOC and volume but you have to concentrate as things dont always jump out at you. Indicators merely highlight whats there and are a god send for a programmer like me. I would never develop a system without indicators of some sort. If indicators aren't reliable its because price is never very predictable, the underlying price causes that unreliableness and traders giving too much mystical significants to the indicator. Its the price data that creates the indicator afterall.
 
oh i really do hope this isnt a statistical fluke....


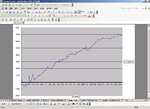
70,000 points on the FTSE...
 

Attachments

  • holy moly.jpg
    holy moly.jpg
    88.3 KB · Views: 275
bogeys.. coding is correct. just a bit unstable and i think it was curve fitting. changing exit parameters slightly would wildly alter the profits/equity curve.

shame really.

back to the drawing board...
 
Did you try buying on weekly uptrends and selling on weekly down trends fettered?

I dont like the wild whipsaws of the first bit of that equity curve. It would blow many out of the water, what are the stop losses used too?
 
tried weekly, similiar to my illumination efforts.

not pretty. im afraid..

i think the first part of the equity curve is to do with the way i have coded it. at least i hope so. i might try coding it from a different start date, and seeing it it is equally wonky there.

btw, no stops were harmed in the making of this strategy. currently a stop-free environment, but they are something i will look into. but i think they will need some cunning use of INDEX() and MATACH() , which i will need to brush up on in the meantime.

hope this helps..

back to my time-machine..
 
Really? :O(
What about... instead of counting a certain number of downs or ups, you have a target before you buy or sell. Something simple like approaching the ema. e.g. on weekly ups, when daily declines near the ema, place buy order above price, weekly downs, when daily rallys near the ema place sell order below price.

Similar rules to the general concept but with an extra condition for when to attempt to enter trades. For timing exits you could use stochastic. i.e. wait for stochastic to tick down before placing sell orders below price (to close a position), wait for stochastic to tick up on shorts before placing cover orders above.

Might be worth a try.
 
Top