Wyckoff Method, The: In The Original

Status
Not open for further replies.
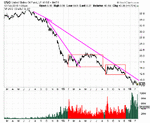
I hope this is no disturbance for this great thread, but observing the action around the oil plunge and given that the future has reached an equilibrium level at $25 I look at USO to potentially trade it.

Of course the downtrend on the weekly is not broken yet. And in terms of the channel, it just bounced from the midpoint. But in terms of volume, this was the highest yesterday for a long time testing the low and apeared a bit less on the way down.

I would be very interested in another interpretation...

uso.jpg
 
The search for equilibrium ended last week but it didn't hold and traders drove price down. Nor is the downtrend broken even on the daily. As far as channels go, W didn't address medians. He hadn't gone that far before he died. Even so, the median of the weekly channel would be used in this context as an opportunity to short, assuming that one hadn't shorted long ago.

As for volume, it is clear that some of The Money is attempting to support price, but they are just as susceptible to being early as the retail amateur. But there's nothing climactic about it, and price continues to fall.

Given the extent of the decline, this won't be making a V reversal. And the only reason to buy so early, if one had compelling evidence that a given stock had bottomed, would be if it paid a dividend, in effect being paid to wait. In the meantime, there are more productive uses to which one's money can be put.

Incidentally, if you get rid of the color, you will find it easier to make more objective assessments.

Db
 

Attachments

  • USO.gif
    USO.gif
    88.5 KB · Views: 442
A further note about USO and anything else for which volume is provided.

One needn't spend buckets on software and programs to find a range, draw a box, and see where the volume lies. One needn't even resort to pencil and paper to see that the volume on the decline from 35 to 15 is only a fraction of the volume logged in during the first trading range, or even the second. These ranges are where resistance lies, not in the drama of cascades. These ranges are what buyers have to get past.

It's this simple.

Db
 

Attachments

  • USO2.gif
    USO2.gif
    24.5 KB · Views: 405
General Instructions
 

Attachments

  • 23M 1.gif
    23M 1.gif
    45.5 KB · Views: 491
  • 23M 2.gif
    23M 2.gif
    50 KB · Views: 433
  • 23M 3.gif
    23M 3.gif
    49.3 KB · Views: 413

Attachments

  • 24M 1.gif
    24M 1.gif
    50.8 KB · Views: 420
  • 24M 2.gif
    24M 2.gif
    48.8 KB · Views: 376
  • 24M 3.gif
    24M 3.gif
    20.3 KB · Views: 372
As for volume, it is clear that some of The Money is attempting to support price, but they are just as susceptible to being early as the retail amateur. But there's nothing climactic about it, and price continues to fall. Db

What you mean is that there has to be at least "a" climax - not talking about "the" climax - in terms of what Wyckoff described in section 7?

So basically that this "can not" be the end and is just a stage on the journey?

I have read section 7 several times and the course in general and it is tough for me, but the credo from section 7 is that climaxes mark potential start and end and in between there are the stages and the serach for equilibrium and so on? All within the context of the continuity of price? Would you agree?
 
There is a conflict between what you see and what you want to see. What you see is that volume is lower on this lower low but you want it to be climactic, so you see it as being higher. This is most likely due to your wanting to buy the bottom tick, which is inconsistent with your signature.

A climax illustrates capitulation. While the current activity in USO illustrates efforts to support price, there have been many such efforts all the way down. As for what appears to be a double bottom, there have also been many double bottoms on the way down.

Even if the stride were broken without a selling climax, which can happen when there's no one left to sell, one could justify buying after such a break, but not before. Your money can be put to more productive use while the re-accumulation process takes place

Db
 
Wyckoff's course is 500p long. The core of it -- less than half that -- has been provided here, the essence of what needs to know and understand in order to trade price effectively, including all the various approaches which stem from Wyckoff.

But there are different levels of "essential". One must first understand the law of supply and demand (post #2). One must also understand how to judge the course of price by applying this law (post #4). If he believes he does understand this, he can then see how this is applied to trading by carefully studying Wyckoff's point by point analysis of this application to the market (post #5) and to an individual stock (post #39). If one then adds to this the information provided by volume (post #11) and trend lines (post #36), he is then ready to begin observing price movement in real time and using what he believes he has learned by taking pertinent notes -- that is, pertinent applications of what he has read -- on what he observes. If his notes are not demonstrably connected to what he has read, then he has not sufficiently absorbed what he has read and should begin again, charts in hand.

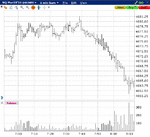
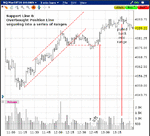
For example, here is a portion of events from last week. Note that the hinge that preceded what is illustrated here is lightly included, as is the supply line tracing the downmove. There are multiple trading opportunities here, but we begin with the 10th since we have to start somewhere, and this is as good a place as any. Note first that price breaks the stride and forms a support line. The overbought position line is then plotted in parallel. Price then reaches overbought status on the 9th and retreats into the range. It then pokes above this line again in the early hours of the 10th, at which time we can begin looking for shifts in the demand-supply balance (it is the nature of the auction market that the balance will shift to supply when demand is overextended).

This shift begins at 0830 NYT. Once price falls and rallies, a supply line can be drawn. Having been plotted, an oversold line can be plotted in parallel (these are not labelled; the takeaway here is how to draw the supply line and then, afterward, the parallel line). If one then shifts his attention to volume as the general session opens, he sees that the volume on the last lower low is lighter. suggesting that the supply/demand balance is shifting toward demand (which is to be expected given the proximity to the oversold position line).
 

Attachments

  • DSTR0210a.gif
    DSTR0210a.gif
    38.2 KB · Views: 497
Note that the chart on the right above is a 2m chart. The shift from supply to demand is even clearer on the 1m chart and especially so on the 5s chart.
 

Attachments

  • DSTR0210b.gif
    DSTR0210b.gif
    41.6 KB · Views: 395
Now follow the course of demand as buying power continues to outweigh selling power. Note that price reaches equilibrium twice, once in the form of a hinge and once in the form of a range. It then reaches toward the timeframe which is of more interest to the monied players (this level is what it is regardless of the bar interval one uses for charting; the swing high on the 8th is the swing high on the 8th: 4046). Volume slacks off as higher highs are attempted, and if one refers to the 5s, he sees demonstrable resistance to any further advance.
 

Attachments

  • DSTR0210c.gif
    DSTR0210c.gif
    36.7 KB · Views: 478
A thrust movement is a sharp run up out of an area of distribution or a temporary bulge through the top of a trading range, which fails to hold. The inability to hold these quick bulges or upthrusts is indicative of weakness in each instance. (Wyckoff)
 

Attachments

  • Thrust.gif
    Thrust.gif
    21.1 KB · Views: 328
[The] stock market, by its own action, continually indicates the probable
direction of its immediate and future trend, and anyone able to determine
this with accuracy should attain success in trading and investing.

Coming events [are] foreshadowed on the tape because large interests
there disclose their anticipation of advances or declines by their
purchases or sales. So, too, with the large speculator who is endeavoring
to raise or depress prices. If one were to become sufficiently expert, he
could judge by the action of stocks what is in the minds of these large
interests and follow them.

The trend is simply the line of least resistance. When a stock meets
opposition in its rise, it must either be strong enough to overcome this
resistance (selling) or it must inevitably turn downward, and when, in its
downward course, sufficient buying is encountered to halt the decline,
it [must] turn upward. The critical moments in all these various phases
of the market are these minor and major turning points. (Wyckoff)
 
Now follow the course of demand as buying power continues to outweigh selling power. Note that price reaches equilibrium twice, once in the form of a hinge and once in the form of a range.

Thanks for this one.

Does the fact that it went through equilibrium twice is for you a sign of a potential turn in the near future?

Disagreement after agreement about "value".

And does this coincide with those "setups" you posted once on TL?
 
Thanks for this one.

Does the fact that it went through equilibrium twice is for you a sign of a potential turn in the near future?

Disagreement after agreement about "value".

And does this coincide with those "setups" you posted once on TL?

Eqs generally serve as a braking mechanism, as when you're driving down a steep hill. As such, the slope of the decline will change if they re-occur in sequence, often transitioning into a base. Whether that becomes a transition to a further decline or a reversal into an upmove will depend on volume.

As for TL, I have no idea. This thread is just Wyckoff, so probably not.

Db
 
And to finish the 11th.

Price can move three directions: up, down, and sideways. Amateurs tend to focus on up and down and head to the kitchen for a sandwich when price moves sideways. But the information that price telegraphs to the trader who's paying attention can be valuable in terms of what it is going to do when the equilibrium process is done.
 

Attachments

  • DSTR0211.gif
    DSTR0211.gif
    60.6 KB · Views: 349
Tape Reading is not merely looking at the tape to ascertain how prices are running.

It is not reading the news and then buying or selling "if the stock acts right."

It is not trading on tips, opinions, or information.

It is not buying "because they are going up," or selling "because they look weak."

Tape Reading is the science of determining from the tape the immediate trend of prices.

It is judging, from what appears on the tape now, what is likely to be shown in five minutes or more.

It is gauging the momentary supply and demand in particular stocks and in the whole market, comparing the forces behind each and their relationship, each to the other and to all. Its object is to determine whether Union Pacific, which is now 159, will sell at 160 before 158, or vice versa; to make deductions from each succeeding transaction, every shift of the market kaleidoscope; to grasp a new situation, force it through the weighing machine of the brain, and to reach a decision which can be acted upon with coolness and precision, all within the space of a few seconds. (Wyckoff)

And it's exactly the same now as it was a hundred years ago: demand, supply, and the balance between them.
 
It is better for a Tape Reader to trade in one stock than two or more. Stocks have habits and characteristics which are as distinct as those of human beings or animals. By a close study the trader becomes intimately acquainted with these habits and is able to anticipate the stock's action under given circumstances. A stock may be stubborn, sensitive, irresponsive, complaisant, aggressive; it may dominate the tape or trail along behind the rest; it is whimsical and coquettish; it may whisper, babble like a brook or roar like a cataract. Its moods must be studied if you would know it and bend it to your will. [NB. In other words, characterize your market, whether your "market" be a stock, an ETF, an index, an index futures contract, a commodity, a bond]

Study implies concentration. A person who trades in a dozen stocks at a time cannot concentrate on one. The popular method of trading (which means the unsuccessful way) is to say: "I think the market's a sale. Smelters, Copper and St. Paul have had the biggest rise lately; they ought to have a good reaction; sell a hundred of each for me."

Trades based on thinks seldom pan out well. [NB. In case you're wondering where "Trade what you see, not what you think" came from . . . ] (Wyckoff)
 
Status
Not open for further replies.
Top