Wot Happens Next (2)

It was only underlined only to see if there is any value in spotting a volume spike- but like you said, it can occur left, right and centre.

No, this is not easy, not at all, very complex, I dont know anyone whom says otherwise. Picking turning points? What degree of accuracy would be needed to show it had any value?

Price moving on nearly no volume = time of day/delayed volume reporting etc. Moving price to action areas with little effort. The key is to look for "out of place volume" in relation to the average "norm". But the volume has to be related to opportunity. So low volume does not really mean much without a relationship.

After all you dont want to stand in the middle of the field when there is no one there to pitch to you:cheesy:

The post was not to suggest this is easy, far from it, sorry if it came across that way?

This is off topic to the thread, so my last post on this. BT only from now on!

I don't see how vol helps me take trades however I suspect it does matter, I just don't know how to use it.

I've looked at it a few times, it doesn't help me. I've abandoned vol altogether.
 
This may not be the thread to talk about volume, but volume was provided in the chart and volume is a part of technical analysis. The mistake most people make with regard to volume is the same mistake they make with regard to "patterns": neither is a predictor of future price direction. As regards volume specifically, volume is nothing more than a measure of trading activity. It has nothing to do with price movement. Price movement is determined by the balance between demand and supply. Whether price moves up on slight volume or huge volume will depend on whether or not demand outweighs supply, not on how many trades (volume) are involved.
 
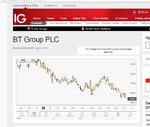
here it is flying
 

Attachments

  • bt.jpg
    bt.jpg
    32 KB · Views: 211
Now down to 294.75 - its on its way. Only 1 unit would have been filled so limit to take profit at 290.00 and stop into 301.00.

Then watch and wait to see if volume comes in on the the other side to set a long up (subject to the correct price action to complement the volume)
 
Now down to 294.75 - its on its way. Only 1 unit would have been filled so limit to take profit at 290.00 and stop into 301.00.

Then watch and wait to see if volume comes in on the the other side to set a long up (subject to the correct price action to complement the volume)

NASDAQ falling off a cliff after FTSE close (although it's struggling back atm) may help :).
 
Based purely on TA off two charts without looking at anything else, this is probably a long bet for me with a SL below 2.97 in case it makes a LLow.

Limit Long Entry @ 311, SL @ 296, target 370s.

I'd be looking to take half position off around 340 and leave the remaining 50% to run.

(y)


BT is now making LLs. Currently at 288.

The 300 support has failed along with the upside expected move.

Revise LLE down to 302, SL @ 287, target area around 330s
 
Now down to 294.75 - its on its way. Only 1 unit would have been filled so limit to take profit at 290.00 and stop into 301.00.

Then watch and wait to see if volume comes in on the the other side to set a long up (subject to the correct price action to complement the volume)

Trade 1 now complete.

Will wait for price and volume to show up in the 280 zone in the correct manner, then look to long back up against the shorters. But we need order first before pulling any trigger.
 
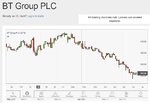
Here update ;

I stated earlier what price would do , it is doing exactly that.
 

Attachments

  • bt.jpg
    bt.jpg
    46.1 KB · Views: 235
Here update ;

I stated earlier what price would do , it is doing exactly that.

Er, no you didn't - stop trying to be a clever dick. You did say that you wouldn't buy in a million years but you never said where you might sell (and of course you think breakouts fail so I guess you never would have).

As I constantly remind you, the threads are not about trying to be clever in predicting movement, but about indicating how you might trade one way or another.
 
Last edited:
BT is now making LLs. Currently at 288.

The 300 support has failed along with the upside expected move.

Revise LLE down to 302, SL @ 287, target area around 330s


BT has continued making LLs and seems to possibly have found 'a' floor at 276.


Taking a long market entry here @ 284.43 with SL @ 279.43. Target area @ 300. Expecting it to reach this previous strong support level.
 
BT has continued making LLs and seems to possibly have found 'a' floor at 276.


Taking a long market entry here @ 284.43 with SL @ 279.43. Target area @ 300. Expecting it to reach this previous strong support level.

Still watching these lows, just want to see a bit more definition in price, and maybe some hints from the volume, that there is no more lower intentions.
 
Still watching these lows, just want to see a bit more definition in price, and maybe some hints from the volume, that there is no more lower intentions.

Yes and you may well be right. I was thinking instead of putting 10-15 point stop I'll split that up into 2 or 3 x 5 point stops and pick a bottom.

I might well get smelly fingers as markets are at highs and if we do have a climb down in indeces I'm sure BT will test the lows again. Hence, the tight stop.

Also, I've always liked the 20 / 80 levels as reasonable over-shoot areas before pull backs to the 100s. :rolleyes:
 
BT has continued making LLs and seems to possibly have found 'a' floor at 276.


Taking a long market entry here @ 284.43 with SL @ 279.43. Target area @ 300. Expecting it to reach this previous strong support level.


BT price @ 294 and on 4H charts it has crossed over MA 50 & 200.

I will be looking to add to position when MA50 crosses MA200.


Position currently up +10 points. SL set to trailing @ 5 points.

This is because there's been an announcement re: invesigation in to PWC audits. Following completion of initial enquiries, the Financial Reporting Council (FRC) has commenced an investigation under the Audit Enforcement Procedure into the audits by PricewaterhouseCoopers LLP of the consolidated financial statements of BT Group plc (BT) for the years ended 31 March 2015 to 2017 inclusive.

I know we are only looking at TA but price can take sharp turns either way. This news also seems to effect PWC more than BT where the bad news is already out.


300 is the area to watch for any pull backs.

Steady as she goes... :whistling
 
BT looks like having some underlying strength or support , a buy now with a stop below the recent low is a trade .Does 300 the previous support become resistance?

As a stock trader I would say 60 /40 probability in favour of a buy
 

Attachments

  • Clipboard01.jpg
    Clipboard01.jpg
    50.2 KB · Views: 233
Top