You are using an out of date browser. It may not display this or other websites correctly.
You should upgrade or use an alternative browser.
You should upgrade or use an alternative browser.
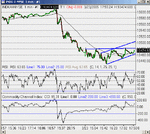
It started to look like a bear flag buty now looking like a triangle with resistance at 480.
Could also be an inverted Head & Shoulders.
Third choice is just consolidation - stuck between 440 & 480.
I guess we have to wait and see if 480 breaks or the triangle support line does and make judgement then.
Could also be an inverted Head & Shoulders.
Third choice is just consolidation - stuck between 440 & 480.
I guess we have to wait and see if 480 breaks or the triangle support line does and make judgement then.
Attachments
Tried to anticipate yesterday...still got my fingers under the cold water tap! I'm interested in tradesmarts 1.2.3. theory, but i'll be watching from the sidelines until it makes a significant move. I still think there is a bit of upside due shortly though?
TheBramble
Legendary member
- Messages
- 8,394
- Likes
- 1,171
I'll wait until your fingers heal before I factor in your expectations. 😎RUDEBOY said:Tried to anticipate yesterday...still got my fingers under the cold water tap! I'm interested in tradesmarts 1.2.3. theory, but i'll be watching from the sidelines until it makes a significant move. I still think there is a bit of upside due shortly though?
Have you considered waiting for development before taking a view?
Bramble, need i say more, you've nailed it matey! O.K. i'll tell you where i'm coming from, i'd lke it to drop to around the 360 mark, pick up some more volume( decent volume) and i'll seriously consider (again!) buying into it. But, what you want and what you get are not always part of the same equation.
TheBramble
Legendary member
- Messages
- 8,394
- Likes
- 1,171
Well, that sounds like a strategy. However, it's unlikely to drop below 400 in the medium term. What timeframe are you trading? What will you do if it bounces off 400 or more likely 450 in the short term?
It's already touched 500 today and may well (who knows 😎 ) break upwards through that before end of play. Would you play toward 600 if that occurred on volume?
It's already touched 500 today and may well (who knows 😎 ) break upwards through that before end of play. Would you play toward 600 if that occurred on volume?
peterpr
Established member
- Messages
- 609
- Likes
- 7
Commiserations.RUDEBOY said:Tried to anticipate yesterday...still got my fingers under the cold water tap! I'm interested in tradesmarts 1.2.3. theory, but i'll be watching from the sidelines until it makes a significant move. I still think there is a bit of upside due shortly though?
The problem with a trade that seeks to anticipate a big scheduled news event is that If I guess right I am tempted to put it down to skill, foresight, analytical abilty etc, and thus likely to try the same thing again. Whereas if I get it wrong I am humbled and forced to think carefully about it. So, which is the more valuable lesson?
Just think of it as an educational cost. - and better value than most of the over-hyped 'how to trade your way to riches' books out there too I'd say.
Not that having a punt is necessarily wrong btw - just as long as I'm clear that's what it is and treat it accordingly
tradesmart
Experienced member
- Messages
- 1,286
- Likes
- 22
I'm interested in tradesmarts 1.2.3. theory
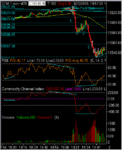
Rudeboy – I was only referring to the short term setup that often occurs in the immediate aftermath of the Fed rates statement, and it worked a treat yesterday as the attached chart…
The crux of the observation is that the first strong move indicates direction, often followed by a reversal which can sometimes be more emphatic than yesterdays bear flag, then the true direction takes over again....
I believe the setup was originally noted by Tom Hougaard who posts as Sunseeker on these boards, so thanks to him for that…..
Tom’s got his own website now, see Trader Tom
Attachments
counter_violent
Legendary member
- Messages
- 12,672
- Likes
- 3,787
If I might give just a little advice that I also should heed .
If the less experienced who read this thread are struggling with the changing short term trends, the best thing to do is "trade only with the predominant trend". This will not guarantee a successful trade , but ought to at least give you an " edge".
Good luck
counter
If the less experienced who read this thread are struggling with the changing short term trends, the best thing to do is "trade only with the predominant trend". This will not guarantee a successful trade , but ought to at least give you an " edge".
Good luck
counter
roguetrader
Senior member
- Messages
- 2,062
- Likes
- 49
tradesmart said:The crux of the observation is that the first strong move indicates direction, often followed by a reversal which can sometimes be more emphatic than yesterdays bear flag, then the true direction takes over again....
Yes nice heads up TS. I don't normally tarde Fed days but I thought I;d hang around and see how that played out 😀
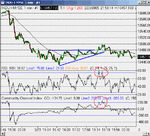
Turned out to be a tough day with a narrow range. That triangle finally broke above 480 but was beaten back as it touched 500.
With RSI at 80ish and CCI above 200 it was no surprise that the breakout failed to get anywhere.
Meanwhile RSI and CCI on the 10 min chart are resting up ... making room for some more downside perhaps or do we see a double bottom forming at 440/432?
With RSI at 80ish and CCI above 200 it was no surprise that the breakout failed to get anywhere.
Meanwhile RSI and CCI on the 10 min chart are resting up ... making room for some more downside perhaps or do we see a double bottom forming at 440/432?
Attachments
User
Experienced member
- Messages
- 1,170
- Likes
- 23
If the less experienced who read this thread are struggling with the changing short term trends, the best thing to do is "trade only with the predominant trend". This will not guarantee a successful trade , but ought to at least give you an " edge".
Nice advise for the newbie's from CV.
peterpr
Established member
- Messages
- 609
- Likes
- 7
counter_violent said:If I might give just a little advice that I also should heed .
If the less experienced who read this thread are struggling with the changing short term trends, the best thing to do is "trade only with the predominant trend". This will not guarantee a successful trade , but ought to at least give you an " edge".
counter
Well it is certainly a well worn maxim that 'the trend is your friend'. For trading purposes though, the problem is in clearly defining what constitutes 'the predominant trend'
For example, if you take almost ANY timeframe above 10 years, the trend is up. Start reducing that time frame and the picture becomes ambiguous. For example, the 5 year trend from 2000 to now has clearly been down (only just on the DOW but no question on FTSE100) . Whereas for the 2 year period to date it has clearly been up. The further you reduce the timeframe, the murkier it gets. All trends are clear with 20-20 hindsight, but a little less so when you are in the middle of them, and especially if you are not absolutely clear about the time-frame you are trading. As always, if you wait for a trend to become crystal clear, you risk missing most of it.
My own (admittedly far from perfect) trend indicator - as many will have gathered - is to use regression channels on multiple time frame charts to seek out median lines where the confidence level is above say 70-80% and increasing with each bar. I then try to trade only in the direction of the trend so revealed and then only close to its extreme counter-trend boundary - all the while watching for signs that its visit to the counter-trend boundary may in fact be a breakout signalling a trend change :!: -
What a bloody carry-on. 😱
peterpr
Established member
- Messages
- 609
- Likes
- 7
Durable goods orders and weekly (4 week rolling) Jobless figures at 1:30 our time. Then house sales for Feb at 3:00 pm our time.
Futures currently up 38 points. Technicals say expect a bounce. Looks like a minimum 100 point intra-day long from about 10460 to me.
Futures currently up 38 points. Technicals say expect a bounce. Looks like a minimum 100 point intra-day long from about 10460 to me.
roguetrader
Senior member
- Messages
- 2,062
- Likes
- 49
Positive tone in the wake of economic data, DOW tracking stock pricing in a 30+ point opening gap up at rhe moment.
It's now had two shots at breaking back over 10500 and fallen back to 10490 in both cases. Looks like a third attempt is in process at 16.30. Nasdaq also trying to break back over 2000.
Will there be a late holiday rally this afternoon or will it sink back toward 10450 on a wave of investor apathy although volume seems strong this morning.
Still short from 10700.
Will there be a late holiday rally this afternoon or will it sink back toward 10450 on a wave of investor apathy although volume seems strong this morning.
Still short from 10700.
roguetrader
Senior member
- Messages
- 2,062
- Likes
- 49
Volume as expected coming in quite light, choppy going out there, not a day for me to play, good trading all.
roguetrader
Senior member
- Messages
- 2,062
- Likes
- 49
kriesau said:although volume seems strong this morning.
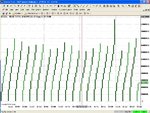
Volume on the NYSE
Attachments
Similar threads
- Replies
- 1
- Views
- 3K
- Replies
- 1
- Views
- 5K


