Where is the Dow & others heading in 2005?

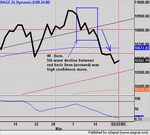
Well it's all a bit will she orwon't she..........break that is. Looking back to Firday, both the DOW and the Naz dropped below the swing low that represented the low for this year, in fact for the Naz it's the lowest level since Nov04. The Naz closed below its swing low by a hair, while the Dow recovered to close above. S&P500 also took a look below but recovered to above. All the major Indexex remain below their 50 day sma's. The SOX lost both its 50 and 200 day sma's though it is not far below and may be able to remount today. Really need to be seeing a showing from the bulls today.
 
I suspect that we may see a round trip as the Dow forms a triangle of uncertainty ahead of the PPI/Fed tomorrow.....a small gap has been left above 640 (futs) that may have to be filled...

No prizes for guessing direction if Mr G drops the word "measured" from the rates statement... ;)
 
Shorted at 10616. Stopped out at 10580 for 36 pts profit. Just gone Short again at 10585.
 
A light vollume lack luster day, bulls need to show a bit more effort to run the bears off. NYSE internals were bearish all day while the Naz was all over the shop. Naz Comp touched it's 200 day sma and bounced, but not a lot of enthusiasm. Coming into monthly trendlines on the SOX and SPX.

All eyes on Greenie tomorrow. Measured or not?
 
There is little doubt left now that we are in a downtrend channel, lower highs, lower lows
etc.
First target of 10,600 has been blown away now , weak looking two day consolidation.
Oil at or near record highs.
Divergences all over the shop.

Still fancy up anyone ?
 
counter_violent said:
There is little doubt left now that we are in a downtrend channel, lower highs, lower lows
etc.
First target of 10,600 has been blown away now , weak looking two day consolidation.
Oil at or near record highs.
Divergences all over the shop.

Still fancy up anyone ?

Its true it doesn't look to clever at the moment but there are the monthly trendline and combined with the Naz at 200 day sma we may be good for a bounce if Greenie doesn't scare imho
 
yesterday:-
I suspect that we may see a round trip as the Dow forms a triangle of uncertainty ahead of the PPI/Fed tomorrow.....
Not a million miles out, but the chart now has a bearish tone with two negative RSI peaks…….

But I suspect that the market is so sensitized to any suggestion of ongoing higher interest rates that anything ambiguous in the FED statement is going to be seized upon and we could see a highly tradeable reaction….

Wait for it…….. ;)
 

Attachments

  • 22-03-05.gif
    22-03-05.gif
    19 KB · Views: 165
Hi all ,last week I left a Q on the Dow Pattern on thur 17th
this is the answer for Newbys to help them see the Close of day price in a pattern it is very basic / simple but I hope it helps them.
this is how I see it.

Tuesday 8th March Dow closed at
10,912
Wed 9th 10,805 market falls for 3rd day down by 107 points this is the start of a declining market and a Lower Low
Thur 10th 10,851 up 46 market trying to recover but fails to reach 10,912
Fri 11th market falls to 10,774 down 77 Lower Low
Mon 14th 10,804 market trying to recover up 30 but fails to reach 10,851
Tue 15th market falls to10,745 down 59 Lower Low
Wed 16th market falls to 10,633 down 112 Lower Low
Thur 17th market falls to 10,626 down 7 Lower Low
Fri 18th 10,629 market trying to recover up 3 but fails to reach 10,745
I do not say reach 10,633 because I think we now have a consolidation area around this number
The pattern is a simple one of lower lows in a declining market taken from the DOW closing price each day
I do not include part points as they are too small and only get in the way of seeing the full number
Mon 21st 10,565 down 64 Lower Low
the Market may go up or down from here, this is not trading advice to anyone just an answer to last weeks Q
regards to all on this thread
be lucky
 
twiggytwo said:
Hi all ,last week I left a Q on the Dow Pattern on thur 17th
this is the answer for Newbys to help them see the Close of day price in a pattern it is very basic / simple but I hope it helps them.
this is how I see it. <Snip>

Attached chart shows the pattern. Thanks Twigs - trust you traded it :)
 

Attachments

  • DOWW.png
    DOWW.png
    57.2 KB · Views: 194
Hi Peterpr, Yes I am still short April Contract S/B my indicator gave a sell signal on 9th March I am short from 10,805 opened on Mon 14th after confirmation signal on Fri 11th
I think we may see a failed try at 10,626 / 10633 today, but we have to wait until the Main Man has spoken at 7.15pm tonight (UK time ) be lucky
regards
 
The “triangle of uncertainty” mentioned yesterday has been better defined today and the 100point height hints at a similar target from the breakpoint, north or south……

A small break north now, but probably an early manifestation of the whipsawing that precedes and follows the Fed announcement….

Recently it has been a 1-2-3 move after the announcement, with the first move confirming true direction, followed by a big reversal, and then the true direction takes over again…

No certainty that this will occur today, but it is one tradeable pattern to watch for imho….
 

Attachments

  • 22-03-05a.gif
    22-03-05a.gif
    18.7 KB · Views: 145
Hmmmnn, been out all day, do I detect the faintest hint of ...bovine in the air? Naz above its downtrend line SPX testing its trendline now, INDU lagging a bit.
 
Last edited:
Recently it has been a 1-2-3 move after the announcement, with the first move confirming true direction, followed by a big reversal, and then the true direction takes over again…
So far, so good....... ;)

the 100point height hints at a similar target from the breakpoint, north or south……
Not far out either........
 
Last edited:
Top