Personally, i don't have an 'absolute' timeframe. Saying this, a day trade is my shortest time frame. This is due to my work circumstances, that's realistic. Opportunities can be found on all timeframes, though i favour short to mid. To be honest, i have no bias. RUDEBOY.
You are using an out of date browser. It may not display this or other websites correctly.
You should upgrade or use an alternative browser.
You should upgrade or use an alternative browser.
hello rude, are you a subscription holder to marketvolume.com? and if so is it worth the sort of money theyre looking for? its good to know im not the only one shorting the dow already,although i do think we are range-bound for at least the next few days.RUDEBOY said:If you are into the Dow, try Market Volume.com. RUDEBOY.
just to clarify rude, are you a member of marketvolume.com? or are you just taking up the free trial? the site looks good and could mean saving a lot of time and bother.RUDEBOY said:Maybe so. Good trading! RUDEBOY.
roguetrader
Senior member
- Messages
- 2,062
- Likes
- 49
Indu
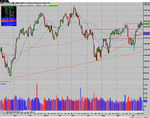
Not an awful lot has changed since last week really, we started with a down day on Monday on very light volume, not surprisingly this was reversed the next day with large volume and followed through on Wednesday with not dissimilar volume. Thursday then gave us a slightly lower volume reversal of that day, and we finished the week as we started with a fairly low volume day. The problem as you can see from the chart all revolves around that 10,650 level and after the midweek action we must now extend that to 10,700 to give us a short-term operating range of 150 points 10,550 - 10,700.
To the upside we have a band of resistance from 10,650 now extending to 10,700, a decisive break of the 10,700 level should see us in the 10,840 area fairly quickly, with the '05 highs a stones throw away.
To the downside we have potential support at the top of the consolidation range around 10,550. Followed by the merging of the major sma's, 20, 50, 200, providing potential support between 10,469 - 10,476. Below that possible support of a swing high from May at 10,380 ish.
Again the INDU has been reluctant to join the SPX and COMPQ, both of which have now registered multi-year closing highs, though there has been some evidence this week of a little more relative strength creeping in. Let's see if that continues next week.
Personally I would like to see a push higher to get more on board the long-side and shake out the weak hands on the short side. As with last week I would say caution on either side is in order. If you have no clear idea of what side of the market you should be on, with no clear plan, then you are trading on hope. That rarely has a good outcome
Attachments
Racer
Senior member
- Messages
- 2,666
- Likes
- 30
JillyB
Established member
- Messages
- 791
- Likes
- 38
roguetrader said:Not an awful lot has changed since last week really, we started with a down day on Monday on very light volume, not surprisingly this was reversed the next day with large volume and followed through on Wednesday with not dissimilar volume. Thursday then gave us a slightly lower volume reversal of that day, and we finished the week as we started with a fairly low volume day. The problem as you can see from the chart all revolves around that 10,650 level and after the midweek action we must now extend that to 10,700 to give us a short-term operating range of 150 points 10,550 - 10,700.
To the upside we have a band of resistance from 10,650 now extending to 10,700, a decisive break of the 10,700 level should see us in the 10,840 area fairly quickly, with the '05 highs a stones throw away.
To the downside we have potential support at the top of the consolidation range around 10,550. Followed by the merging of the major sma's, 20, 50, 200, providing potential support between 10,469 - 10,476. Below that possible support of a swing high from May at 10,380 ish.
Again the INDU has been reluctant to join the SPX and COMPQ, both of which have now registered multi-year closing highs, though there has been some evidence this week of a little more relative strength creeping in. Let's see if that continues next week.
Personally I would like to see a push higher to get more on board the long-side and shake out the weak hands on the short side. As with last week I would say caution on either side is in order. If you have no clear idea of what side of the market you should be on, with no clear plan, then you are trading on hope. That rarely has a good outcome
I would add to that, that the INDU has again been making higher lows last week, just as it did in the previous consolidation in May.
It is therefore possible that we may see a similar pattern forming here over the next week , with only small advances being made, but the lows creeping slightly higher each time. Again it's the formation of the 'Pressure Cooker' syndrome, with everyone watching to see in which direction the breakout will be.
Racer
Senior member
- Messages
- 2,666
- Likes
- 30
ducati998 said:Racer
Regarding CAT
Intrinsic Value $22.10.................overvalued currently by 42% at current closing price of $52 odd
Dividend Yield 1.90%
10yr Bond Yield 4.22%
Therefore dividend yield is 45% of the bond yield. For investors, we would look for at least 66% yield on the dividend.
Therefore I would not expect to see any concerted buying from an investor standpoint until it was around the $22 mark, and the value hounds even below that figure.
If your theory holds that the DOW will follow CAT, then more of the same, sideways, in a fairly wide range of 1500pts.
cheers d998
Thank you ducati998
Even with the weighting cut down, CAT could be a good clue to the Dow, because of its link with housing and interest rates.
Note existing home sales figures on Monday.
And will the chart be an island reversal?
roguetrader
Senior member
- Messages
- 2,062
- Likes
- 49
Jill that would be fair comment, and a very possible scenario.I would add to that, that the INDU has again been making higher lows last week, just as it did in the previous consolidation in May.
It is therefore possible that we may see a similar pattern forming here over the next week , with only small advances being made, but the lows creeping slightly higher each time. Again it's the formation of the 'Pressure Cooker' syndrome, with everyone watching to see in which direction the break-out will be.
Rudeboy, that rather depends on a lot of things. For example how are you determining that the DOW is over-bought? Even if your determination was accurate over-bought can quite easily become more over-bought. Over-bought stocks, indices, whatever can correct in two manners. The most obvious is by price, ie a pull-back, and the other by time, consolidation, which may take the form of sideways movement or a running correction where the upward momentum reduces significantly, but the stock continues to rise in a consolidation like manner. The concept that there is such a trade where "break-even at worst" is likely is a hopeful concept.Hello, RT. If the Dow continues, on an overbought basis, surely this will lead to an even more prominent downside.....whatever? Go in now.....break even at worst? RUDEBOY.
Other things of course would be the size of your account and how much pain you can tolerate, a short trade here has the support of the fundamentals and should eventually yield a profit, but you may have to wait some time for that if we break-out here. I have noticed people on these boards talking about covering shorts, whilst I would not tell anyone how they should trade their accounts, I do not see any reason why a recently placed short (last several days) should be covered, assuming of course it was placed for the "big move down" nothing much has changed so the reasons that made you short should still be in force.
The point is not that short or indeed long, are wrong but that people should know why they are in a trade and what parameters change that, ie be trading to a plan. Not "well short looks good here so I'll stick it on and workout what to do as we go along."
RT. I fully understand what you are saying, but, you can not stay on the fence forever? As traders, we may well be on the fence more than we are in the market. That goes with it all. But, at some point you have to pull the trigger (that is personal), i'm pulling my trigger now! It does not mean to say i am right about the Dow, but, it means i am right about my own feelings. If the trade goes wrong, i will adapt and overcome. RUDEBOY.
roguetrader
Senior member
- Messages
- 2,062
- Likes
- 49
Spx
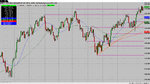
The SPX consolidated it's position last week around its multi-year closing highs. Monday started us off with a down day, but on very light volume which was reversed Tuesday with a strong volume day and followed through Wednesday with another strong day of gains taking out the years intra-day high and registering a new multi-year closing high. Thursday however was a strong volume down day erasing that, and Friday then reversed most of that, though on much weaker volume. Great indecision.
To the upside we have potential resistance of last weeks intra-day high at 1236, and after that a target of 1253.
To the downside, last weeks low of 1221, followed by about 1218, then the 20 day sma currently at 1212 then a broad band of consolidation from 1205 down to 1190, within which lies the 50 day sma at 1202.
The SPX has been considerably stronger than the INDU in recent months. I personally would like to see 1253 hit. Lot's of earnings and economic data out this week, so we're are likely to remain volatile.
Attachments
Racer
Senior member
- Messages
- 2,666
- Likes
- 30
Racer
Senior member
- Messages
- 2,666
- Likes
- 30
dow splits
Below is a list of some shares in the dow and the splits, note GM has only had one compared to some of the others!
Also note the different ratios.
So conclusion.. why bother with long term charts!!
🙄
AA
Splits:04-Feb-74 [3:2], 23-Feb-81 [2:1], 27-Feb-95 [2:1], 26-Feb-99 [2:1], 12-Jun-00 [2:1]
AIG
Splits:18-Nov-86 [2:1], 23-Jul-90 [5:4], 30-Jul-93 [3:2], 31-Jul-95 [3:2], 28-Jul-97 [3:2], 03-Aug-98 [3:2], 02-Aug-99 [5:4], 31-Jul-00 [3:2]
AXP
Splits:11-Feb-83 [4:3], 11-Aug-83 [3:2], 11-May-87 [2:1], 11-May-00 [3:1]
BA
Splits:13-Sep-77 [2:1], 16-Apr-79 [3:2], 15-Apr-80 [3:2], 10-Jun-85 [3:2], 12-Jun-89 [3:2], 11-Jun-90 [3:2], 09-Jun-97 [2:1]
C
Splits:13-Mar-87 [2:1], 01-Mar-93 [3:2], 30-Aug-93 [4:3], 28-May-96 [3:2], 25-Nov-96 [4:3], 20-Nov-97 [3:2], 01-Jun-99 [3:2], 28-Aug-00 [4:3]
CAT
Splits:26-Jul-76 [3:2], 06-Sep-94 [2:1], 14-Jul-97 [2:1], 14-Jul-05 [2:1]
DD
Splits:29-Jun-79 [3:1], 22-Jan-90 [3:1], 13-Jun-97 [2:1]
DIS
Splits:18-Dec-62 [103:100], 01-Mar-71 [2:1], 16-Jan-73 [2:1], 06-Mar-86 [4:1], 18-May-92 [4:1], 10-Jul-98 [3:1]
GE
Splits:08-Jun-71 [2:1], 02-Jun-83 [2:1], 26-May-87 [2:1], 16-May-94 [2:1], 12-May-97 [2:1], 08-May-00 [3:1]
GM
Splits:29-Mar-89 [2:1]
roguetrader
Senior member
- Messages
- 2,062
- Likes
- 49
Compq
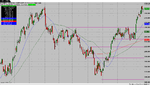
The COMPQ in keeping with its recent performance demonstrated the most relative strength on the week. like the other two major indices we started with a down day on Monday on light volume, this was followed up Tuesday by a gap and go day on much heavier volume. After an initial gap down on Wednesday the index moved higher on strong volume to set a multi-year closing high. Thursday saw a multi-year intra-day high, before selling off. Friday saw some follow through on the selling before an afternoon reversal. In 2 1/2 months we have reversed 4 months of selling in this index. Pull-backs have been shallow to date and I would be inclined to think a rest was due.
To the upside, there are no near-term levels to look at, 2193 last weeks high and beyond that possibly a bounce high set in May 2001 of 2328.
To the downside, last weeks low of 2144 followed by the 20 day sma currently at 2114 and then the break-out point of 2100.
Attachments
Similar threads
- Replies
- 1
- Views
- 3K
- Replies
- 1
- Views
- 5K