You are using an out of date browser. It may not display this or other websites correctly.
You should upgrade or use an alternative browser.
You should upgrade or use an alternative browser.
roguetrader
Senior member
- Messages
- 2,062
- Likes
- 49
I don't know,,,,,,,,Just no pleasing some people 🙂Racer said:8 more points in 25 mins! Verrry BIG bounce that! 🙄
Total market volume down about 20% on this time yesterday, but the bulls are a creeping while the bears are a sleepin'
NYSE internals now quite positive. but Nasdaq still mixed, leaning more bearish than anything, but have been improving since 18:00
Lunchtime move again, often not for real.
roguetrader
Senior member
- Messages
- 2,062
- Likes
- 49
Go baby go.
Racer
Senior member
- Messages
- 2,666
- Likes
- 30
XOM managed to get the Dow moving up, but I wonder was it on very thin vols?
Would anyone like to comment on CAT over the weekend, this share could give a big clue to market direction because of its weight
Some bull points and some bear points in the analysis please!
Would anyone like to comment on CAT over the weekend, this share could give a big clue to market direction because of its weight
Some bull points and some bear points in the analysis please!
Racer
Regarding CAT
Intrinsic Value $22.10.................overvalued currently by 42% at current closing price of $52 odd
Dividend Yield 1.90%
10yr Bond Yield 4.22%
Therefore dividend yield is 45% of the bond yield. For investors, we would look for at least 66% yield on the dividend.
Therefore I would not expect to see any concerted buying from an investor standpoint until it was around the $22 mark, and the value hounds even below that figure.
If your theory holds that the DOW will follow CAT, then more of the same, sideways, in a fairly wide range of 1500pts.
cheers d998
Last edited:
Racer
I have noticed that the weighting of Cat on the Dow has dropped a lot lately therefore not such a dow mover look at the link below it seems to be IBM & 3M at the mo are the golden ones
http://www.djindexes.com/mdsidx/index.cfm?event=showComponentWeights&rptsymbol=DJI&sitemapid=1
Rustic
I have noticed that the weighting of Cat on the Dow has dropped a lot lately therefore not such a dow mover look at the link below it seems to be IBM & 3M at the mo are the golden ones
http://www.djindexes.com/mdsidx/index.cfm?event=showComponentWeights&rptsymbol=DJI&sitemapid=1
Rustic
roguetrader
Senior member
- Messages
- 2,062
- Likes
- 49
Racer, total market volume declined in yesterday's trade. NYSE total volume was approx 17% lower than the previous day, Nasdaq total volume declined by approx 18% and INDU specific also declined by about 17%.Racer said:XOM managed to get the Dow moving up, but I wonder was it on very thin vols?
From a volume analysis if anything that is probably mildly bullish given that the indices spent most of the day in the red.. At the end of the morning session NYSE volume was 21% behind.
Racer
Senior member
- Messages
- 2,666
- Likes
- 30
rustic1 that is very interesting, if it is split then the weighting is split and alters ithe effect on the Dow considerably.rustic1 said:Racer
I have noticed that the weighting of Cat on the Dow has dropped a lot lately therefore not such a dow mover look at the link below it seems to be IBM & 3M at the mo are the golden ones
http://www.djindexes.com/mdsidx/index.cfm?event=showComponentWeights&rptsymbol=DJI&sitemapid=1
Rustic
This makes charting the Dow more unreliable.. same as when some are changed, which isn't very often for the Dow
roguetrader
Senior member
- Messages
- 2,062
- Likes
- 49
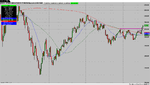
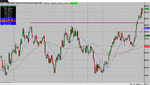
SOX has had a pretty impressive run from the April lows, rising some 10%. I would expect some consolidation at the very least, if not a reasonable retrace. Weekly chart looks bullish, but daily chart showing some signs of fatigue.Racer said:5 day chart of SOXX is interesting, note yesterday open much higher then fell back to close at lower point of the day but that was still up a lot and it was lower than high close of Weds (from what I can see)SOXX
Attachments
Racer
Senior member
- Messages
- 2,666
- Likes
- 30
Those charts are interesting indeed, especially the weekly, evidence of bullish but slowing 3 candleroguetrader said:SOX has had a pretty impressive run from the April lows, rising some 10%. I would expect some consolidation at the very least, if not a reasonable retrace. Weekly chart looks bullish, but daily chart showing some signs of fatigue.
and final candle on daily a possible top for now, agreed.
Racer
Senior member
- Messages
- 2,666
- Likes
- 30
Racer said:rustic1 that is very interesting, if it is split then the weighting is split and alters ithe effect on the Dow considerably.
This makes charting the Dow more unreliable.. same as when some are changed, which isn't very often for the Dow
Correct. The Dow is price weighted. IBM is the big kid now. This is a fundamental edge that is easy to grab - pick out 6 or so of the big ones and you've got a pretty good idea which way things are going in a given day.
To that I would add GE.
This week has been ear marked for quite an important top by a few.
Robert McHugh suggesting an Fibonacci PHI date between 22nd -26th. These have been remarkably good since 2000.
We also Have a set of birthdates from an excellent Trader called Tepid who have been to working very well through the year 24th July being the next turn. I do not know how his family dates work but so far this year they have. Weird I know.
We also have the 45 & 90 day cyles due to be topping anytime.
So I hope at last we are going to see a pullback not sure if it is the huge wave 3 some are talikng about or we retace a bit then go up again into late August then top out fully.
Rustic
I've shorted @630. No stop, i'll leave that up to Mondays action. The last week created quite a considerable amount of volume, mostly resistive. Taking everything into consideration, why not short it? It's only a matter of when, not if. Come on let's face it, it's time to get your shorts on! RUDEBOY!
Racer
Senior member
- Messages
- 2,666
- Likes
- 30
Treller said:Correct. The Dow is price weighted. IBM is the big kid now. This is a fundamental edge that is easy to grab - pick out 6 or so of the big ones and you've got a pretty good idea which way things are going in a given day.
To that I would add GE.
Yes I have understood dow to be price weighted for some considerable time, but I was not aware of the fact that a split cuts the weighting. So this means that the charts underlying movers have altered so following movements can be less reliable gauged against the past
Similar threads
- Replies
- 1
- Views
- 4K
- Replies
- 1
- Views
- 5K