Where is the Dow & others heading in 2005?

Raw Materials up 6.1%, Producer Prices up 3.5% and Oil up 40% over the last 12 months. One better or worse month for the individual measurement of prices is insignificant - it is the longer term trend that really matters !

Despite Greenspans soothing words of comfort, the reality is that inflationary pressures are clearly evident and the Fed will have no choice but to keep interest rate hikes going beyond June and August.
 
Notwistanding the previous I still say, and in accordance with all my previous comments till now, that the Dow is in Bull Phase.
 
Richmond Fed head Lacker said he is pleased with inflation expectations and believes it is too early to say where rates will stop.
 
NYSE internals slight positive bias, Nasdaq internals neutral to slightly negative in early going. NYSE total volume slightly ahead of yesterdays pace , Nasdaq about even.
 
Fed Gov Bies said that In the commercial and residential real estate sectors, they were worried that borrowers could become increasingly speculative, buying beyond their means and hoping for asset price appreciation -- whether they are buying for their own use or strictly for the sake of investment. Regulators worry that in the inevitable downturn, credit quality could deteriorate to the extent that some banks would experience significant losses.
 
SOCRATES said:
Notwistanding the previous I still say, and in accordance with all my previous comments till now, that the Dow is in Bull Phase.


Hi Socrates, I agree Bull Phase, I see the range closing up and what was 10,427 to 10,540
to now be 10470 to 10559 time will tell, but if we do break 10,600 I see 10,633 as a resting /consolidation area
.Best regards :rolleyes:
 
twiggytwo said:
Hi Socrates, I agree Bull Phase, I see the range closing up and what was 10,427 to 10,540
to now be 10470 to 10559 time will tell, but if we do break 10,600 I see 10,633 as a resting /consolidation area
.Best regards :rolleyes:
Interesting thoughts, my view would be that we are in the resting consolidation area, a confirmed break of 608 area with volume would have the years highs in play in very short order. But that is if we finally resolve to the upside.
 
Into lunch and Nasdaq internals continue to deteriorate slowly while NYSE internals hold near the highs.
NYSE total volume slightly ahead of yesterdays pace Nasdaq volume lagging.
 
Joules MM1 said:
RT I'm interested to see which way the ping will go (if any) when the SOX hits that mark. A set of black box triggers is sure to be registered.
The 200 week sma currently sitting at 425.6 currently we are 1 point above, trouble with it being a wekly MA as you know violation is acceptable on a daily basis, even we were to close below this week it would require a confirmation next week. There is horizontal support and a prior gap at 425 which has provided support once already on June 9th.
 
Hope the JPG comes out okay -
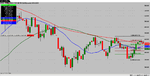
first off please nobody ask me what the wierd indicators are - I just drew coloured blobs in 'Paint'. Look at the sequence, blue bottoms, red tops on the daily chart - it it heading uphill from approx April 18 to the last red blob in 3rd week of May, which it soon becomes apparent is inside the consolidation phase.

From then on we're in a trading range from about 10420 to 10600 (quickly sketched horizontal lines). The last 3 bars (today still in progress) are uphill, higher highs and higher lows, bulls could make a case I suppose but you've got to figure that the trading range is still intact, so treating it as a bullish breakout would be mindless optimisim, the bottoms ARE rising though, the pattern is becoming more triangular at the right hand side, so optimistic bulls have some sort of case.

Resumption of prior trend is generally a better bet than reversal - so I'm with Soc on probabilities for a start, but as I see it you trade this as a chart stuck in a trading range until it breaks out... what's with all this forecasting that the breakout is due? Suppose triple (quad <g>) witching passes and the market is still undecided? You might go bearish on fundamentals, I'm unaware of any form of TA that would describe this as a bearish chart based on where the candles are going or have been for the past few months.

IF the chart breaks below 10420 or so then fine, it's near the top at 10600 or a reverse up near 10420+, and the closer we are to those limits the happier I get.

Currently I'm watching to see whether it drops below today's range, or breaks above it - I suspect 'up', but will trade either.

Cheers
 
Last edited:
Joules MM1 said:
RT for the room can you post a chart with that, please?

Sure, there you go, also 60 minute chart with the gap if thats what you were interested in.
 

Attachments

  • SOX weekly.png
    SOX weekly.png
    34.7 KB · Views: 129
  • SOX 60 min.png
    SOX 60 min.png
    30.8 KB · Views: 124
Last edited:
Joules MM1 said:
Thanks RT.

I clearly misunderstood your post and thought you had said "day" and not "week" so obviously I was looking at a 200day SMA.....and wondering what ws wrong with the chart. Both those SMAs are very close and I think the day SMA also has a tirgger set for quite a few large institutionals.

Maybe some table tennis between the two?

200 day sma currentl at 411
 
Right back to yesterday's high... and now dropping back. The next bar or two should be interesting, will it resume the climb?
 
If once again we give the majority of the days gains back then that'l be highly bearish imho.

It will indicate the lack of institutional participation to the upside.

Nasdaq down also imho means that the direction is about to turn and normally Nasdaq is a good leader of direction to start with....

Well what ever happens, the remainder of the session should be pretty interesting.

Added once again to the shorts at 10580....
 
looks like its going to spike up and down till friday - till all those "thingys" expire....
 
Top