Hi Kris,
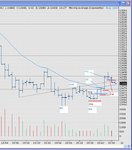
thanks or the reply - I'm curious about the 50% retracement you mention, which prices etc are you referring to there? I've attached a monthly Dow chart going back to 2000 and I make the low late 2002 at 7197, with 11750 the absolute high of the tallest bar on the chart - although the slightly later 11350 is more where I'd place the start of the fall (April 2001), giving a drop - depending where you want to start the fall of say 4000-4500 in round figures, which would place a 50% retrace at around 9200-9500 or so. With the market currently around 10500 it's more like 75% by my reckoning. Is this a function of that Yahoo price problem or are you putting the levels in different places to me? Using later highs for the top etc (such as March/April 2002 one) you can even make a case for a 100% retracement as the market has actually returned to about where it was 3 years back.
I find the whole market looks quite curious over the past 5 years - I 'remember' lots of bearish stuff and general woe, and I reckon the long tails dipping down on the chart contributed to that feeling, but looking back at it the thing that most strikes me is the long sideways periods that are in view.
Cheers,
Dave