Where is the Dow & others heading in 2005?

kriesau said:
Actually the current consolidation range over the last 2 weeks is more like 200pts, with support at 10400/420 and resistance at 10580/600.

I'm also bearish, particularly with the trade deficit/budget deficit figures due out on Friday but we could first see a move up during the early part of the week before it makes a downward break through support at 10400.

Perhaps, but I wouldn't be looking for it to go down as far as 10420 at the moment. The low of 20th May at 10423 hasn't been repeated since. 10426 on 25th May was the next lowest, with 10448 on Friday.

This was what made me play safe with my trade on Friday and put my order to close the trade at 10450. I would still say that a safe consolidation range for trading purposes is only down as far as 10450.

If you take the highs and lows of the past two weeks then there is a slight upward bias to this consolidation, with it making slightly higher highs and higher lows.

This is another reason why I'm not bearish on the Dow just yet. Until I see a close below 10400, I won't be convinced that this is the way its going.

As far as the trade defecit/budget figures on Friday - take a look at last Wednesday and see what happened to the index when all the news that day was bad. It went up - basically because the bad news wasn't as bad as everyone thought it was going to be, so who knows. 😱
 
JillyB said:
Perhaps, but I wouldn't be looking for it to go down as far as 10420 at the moment. The low of 20th May at 10423 hasn't been repeated since. 10426 on 25th May was the next lowest, with 10448 on Friday.

This was what made me play safe with my trade on Friday and put my order to close the trade at 10450. I would still say that a safe consolidation range for trading purposes is only down as far as 10450.

If you take the highs and lows of the past two weeks then there is a slight upward bias to this consolidation, with it making slightly higher highs and higher lows.

This is another reason why I'm not bearish on the Dow just yet. Until I see a close below 10400, I won't be convinced that this is the way its going.

As far as the trade defecit/budget figures on Friday - take a look at last Wednesday and see what happened to the index when all the news that day was bad. It went up - basically because the bad news wasn't as bad as everyone thought it was going to be, so who knows. 😱
Where do you get your figures from since they don't correspond to mine ? The low on May 20th was 10401 and on May 25th it was 10396.

I would agree that we have to see a convincing breach below 10400 before any major move down but to break up out of this range it has got to convincingly breach 10600 which it has failed to do over the past 2 weeks.

As far as fundamentals are concerned, the markets reaction is not always entirely predictable since it depends on what their expectations are and to what degree this is already factored into the price. On some no news days the markets rise or fall without any discernable reason and then there is always some retrospective analysis to rationalize what has happened.

Today is a no news day. Oil is back up to $55.50 which is a 7% increase over last week.
 
kriesau said:
Where do you get your figures from since they don't correspond to mine ? The low on May 20th was 10401 and on May 25th it was 10396.

I would agree that we have to see a convincing breach below 10400 before any major move down but to break up out of this range it has got to convincingly breach 10600 which it has failed to do over the past 2 weeks.

As far as fundamentals are concerned, the markets reaction is not always entirely predictable since it depends on what their expectations are and to what degree this is already factored into the price. On some no news days the markets rise or fall without any discernable reason and then there is always some retrospective analysis to rationalize what has happened.

Today is a no news day. Oil is back up to $55.50 which is a 7% increase over last week.

My figures are taken from ProRealTime end of day. However I have just looked at these on Yahoo, and can see that the highs and lows for each day are different, although the open and close remain the same. Yahoo do give the low as 10400. Very curious!!!

I trade with CMC and their low for the day is in line with the ProRealTime. So who is correct?

I agree that any upward movement would need to breach 10600 and close above this to convince me of a definite upward movment. The 50% Fibonacci retracement for the March-April downward trend is at 10608, so the index reaching this would be convincing.

As far as the data goes, I think it is very much a wait and see scenario. Yes I agree that data can already be factored into the market before it is actually released.

On CMC the pre-open Dow is already trading up on it's close of Friday, despite the news on oil prices. 🙄
 
JillyB said:
My figures are taken from ProRealTime end of day. However I have just looked at these on Yahoo, and can see that the highs and lows for each day are different, although the open and close remain the same. Yahoo do give the low as 10400. Very curious!!!

I trade with CMC and their low for the day is in line with the ProRealTime. So who is correct?

I agree that any upward movement would need to breach 10600 and close above this to convince me of a definite upward movment. The 50% Fibonacci retracement for the March-April downward trend is at 10608, so the index reaching this would be convincing.

As far as the data goes, I think it is very much a wait and see scenario. Yes I agree that data can already be factored into the market before it is actually released.

On CMC the pre-open Dow is already trading up on it's close of Friday, despite the news on oil prices. 🙄
Yes the Dow Futures are up on Fridays close BUT they went up on Friday night, prior to the 9.45pm shutdown, to 10487. This morning, as at 10.25am, they had fallen back slightly to 10480.
 
The 50% Fibonacci retracement for the March-April downward trend is at 10608, so the index reaching this would be convincing.

Hi JillyB, the 50%fib is at 10,492, the area we are all over at the moment, I point this out, not to be picky, but rather that you seem to be attaching a reasonable amount of importance to the fact that this is the 50% fib, I know some people do make trading decisions based on this level.. If it is of any use the level you are quoting is at 61.8%
 
roguetrader said:
Hi JillyB, the 50%fib is at 10,492, the area we are all over at the moment, I point this out, not to be picky, but rather that you seem to be attaching a reasonable amount of importance to the fact that this is the 50% fib, I know some people do make trading decisions based on this level.. If it is of any use the level you are quoting is at 61.8%

Well spotted. Sorry my mistake - this is what happens when I have a busy morning. Should be 61.8%.
Apologies.
 
Thanks for your posting Joules, (haven't worked out which flag yet 🙄

I am a bit confused by your explanation though.

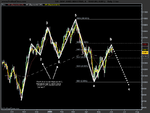
Chart 1: Is this what you mean?
I am sure it's not, as 4 is lower than 2 and would not be a valid count. Even so, still pointing down. Every count I try gives me the same output. That the high of the 1st of June was a swing high.

Chart 2: I am sure that I have seen this pattern described somewhere, possibly by Nison or Elder (Nison more likely).
I cannot recall it or find it anywhere.
That is the 4 similar peaks (sideway movement) preceding the three higher peaks which look like a H&S. It was called something like 'mountains and a house' or something similar. Anyone knows?

And if we are at the right shoulder, that would also imply bearish conditions.
 

Attachments

  • DOW JONES INDUSTRIAL 4.png
    DOW JONES INDUSTRIAL 4.png
    18 KB · Views: 168
  • DOW JONES INDUSTRIAL 5.png
    DOW JONES INDUSTRIAL 5.png
    21.5 KB · Views: 158
Domed House

Thank you RT That is what I was looking for, although I was hoping for something like '4 descending peaks and a domed house' :cheesy:
 
Joules MM1 said:
I'll take that as a message for me :cheesy:

Cheers RT.

Also that picture of the dome thingy looks like Lisa and Bart having a pow-wow !!

A tad too generic for me and crikey, would have to wait a mighty long time to know its gonna be of any use.

ROFL Joules, couldn't agree more.

Just saw an amusing broker call I thought I'd share.

Broker calls

Rosetta Group Research cut Sun Microsystems, Inc. (SUNW: news, chart, profile) to sell from neutral, saying its decision to acquire Storage Technology Corp. (STK: news, chart, profile) is comparable to "a garbage truck jumping into a landfill." The broker told clients it believes that of all the things Sun could do with its cash, it chose to acquire a company that is hardly growing in a mature market that is completely passe.

I trust SUNW are suitably flattered, guess he's off the Xmas dinner invite, unless it is for a guest appearance as the after dinner punch bag 😆
 
Last edited:
Volume look at 11am EST shows both NYSE and Nas total volume lagging the past 3 days

Internals bearish, though not terrible, TRIN's high though at 1.5 and 1.2 respectively
 
Internals improving somewhat on both markets going into lunch 12 EST shows volume still lagging badly on both markets
 
Kris,
it might be worth checking your datafeed against a few others - TC2000 DJ30 20 May low 10423.88 25 May low 10426.39, eSignal has the same figures, these seem to tie in with (I think it was) Jill's... eSignal actually has 10426.46 as the lowest low on the 10 min chart for 25th, so where the odd 7c went I don't know.

The only way I can imagine such large discrepancies is if you were perhaps looking at a slightly different instrument?

Dave
 
DaveJB said:
Kris,
it might be worth checking your datafeed against a few others - TC2000 DJ30 20 May low 10423.88 25 May low 10426.39, eSignal has the same figures, these seem to tie in with (I think it was) Jill's... eSignal actually has 10426.46 as the lowest low on the 10 min chart for 25th, so where the odd 7c went I don't know.

The only way I can imagine such large discrepancies is if you were perhaps looking at a slightly different instrument?

Dave
The historical data was for the Dow 30. I just think that the Yahoo data provider has somehow got it wrong since it doesn't even appear to correlate with their own Charts.. Their historical data for the SPX and NDX does correlate with their Charts and appears to be correct.
 
Yahoo historical DJ30 data is partially "constructed" therefore will be different to the real index values. Open & close will be good enough, but Yahoo high is the sum of all the DJ30 stocks highs, same for the low. Don't ask me why !

rog1111

kriesau said:
The historical data was for the Dow 30. I just think that the Yahoo data provider has somehow got it wrong since it doesn't even appear to correlate with their own Charts.. Their historical data for the SPX and NDX does correlate with their Charts and appears to be correct.
 
Back
Top