Where is the Dow & others heading in 2005?

Google is now valued higher than American Express, Anheuser Busch (Budweiser) and McDonalds. Put in another context, only 7 Uk listed companies have higher market capitalisations. Something has to give, either most companies are greatly under priced and shares will have to soar to attain fair value or holders of Google are heading for deep trouble.

The shares are already in nose bleed territory; here are the basic numbers
$67 billion market cap
$3.8 billion turnover
$704 million profit
PE 96.3
 
user said:
RT whats the volume telling us?

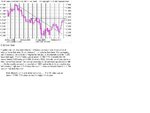
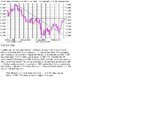
Volume has picked up with this move, but still lagging Friday on the NYSE and therefore not confirming the move higher imho. The INDU has broken above the trendline from '02 and is now nearing the swing highs from Mar / Apr range, SPX already above that level
Breach of 568 brings a target of 608 into play, a swing low from Feb
 
We broke out after range trading for most of the session and had we moved another 10 points lower from the close price during the session then we would have given back the upside breakout that we saw at around 19.00.

In terms of touching 11,000.....HEAVY resistance at 10860 region on weekly chart.

For Tuesday we have support and seems like possible test of 10500. On the upside we have a little problem at around the 10550 area before we even think about 10600.

The intraday high that we saw today: is this the high of this upmove??? I reckon it could well be.

Volume did not support the move up and a break of 10500 could well lead us to play with 10400 before the end of this week.

I'm a little skeptical of the intraday breakout we saw in todays session.
 
Attached chart.....have a look....
 

Attachments

  • Dow Daily quick chart.JPG
    Dow Daily quick chart.JPG
    88.5 KB · Views: 149
Last edited:
roguetrader said:
I'd be looking at a band from500 to 560 as an impass, 500 is a nice round number, the 50% retrace of the move down lies just below at 493 , a trendline from the lows in '02 sitting at the moment around 538 and the highs of a range late Mar early Apr top out around 571, so a lot of stuff in and around here here.

Well resistance held for today, volume declined in the NYSE allbeit slightly from Friday, but then Fridays volume was nothing to shout about. Today was the lowest volume day on the NYSE since April 11th. This tells me that institutions are still not prepared to buy into the market, at least not at this level. The big question is, can the indices push higher to a level that will attract volume, wherever that might be.
 
The big question is, can the indices push higher to a level that will attract volume, wherever that might be.

NO 😈 thats my consensus anyway....

We're topping out
 
user said:
NO 😈 thats my consensus anyway....

We're topping out

I'd be inclined to agree with that, the only thing that I can see drive us higher from here would be some hyped news event, a lot of todays move I believe was likely the result of stop running on the INDU and SPX, some likely hiding places for stops invaded today. So tomorrow could be interesting. Gap and cr*p would be nice 😈
 
I've just edited the chart, missed out a sentance...
 

Attachments

  • Dow Daily quick chart.JPG
    Dow Daily quick chart.JPG
    88.5 KB · Views: 156
Contrarian caution
By Mark Hulbert, MarketWatch
Last Update: 12:01 AM ET May 24, 2005

ANNANDALE, Va. (MarketWatch) -- What will the stock market do for an encore?


The stock market over the past month or so has been adhering quite closely to a contrarian script, rallying impressively in the face of significant pessimism. (Read archived column.)

As of Monday night's close, the (SPX: news, chart, profile) S&P 500 and the (COMP: news, chart, profile) Nasdaq Composite index had climbed back to two-month highs.

What does the sentiment picture say is likely to happen from here?

I wish I could be as upbeat today as I was in late April. But I can't. The latest data from the Hulbert Financial Digest paint a significantly less bullish picture than a month ago.

Consider the Hulbert Stock Newsletter Sentiment Index (HSNSI), which measures the average stock market exposure among a subset of short-term market timers. As of Monday's close, the HSNSI stands at 21.8 percent.

To be sure, since this is far below the index's all-time high of 79.7 percent, the current reading is no where close to being so high as to trigger a contrarian-based sell signal. So at least to this extent, today's sentiment picture can still be interpreted bullishly.

At a minimum, however, there are several storm clouds on the horizon. And it behooves us to pay them close attention.

Consider first how the current reading contrasts with that of a month ago. On April 20, for example, the HSNSI stood at negative 28.3 percent. That means that the average short-term market timer has increased his exposure to the stock market by more than 50 percentage points in just over a month's time. Contrarians would be more confident in the sustainability of the market's rally if advisers had not been so quick to jump on the bullish bandwagon.

Another storm cloud emerges when we focus on the contrast between the HSNSI's current level and where it stood the last time the stock market was trading at current levels.

On April 12, when the ($INDU: news, chart, profile) Dow Jones Industrials Average closed at 10,508, only slightly below the 10,524 level at which it closed Monday, the HSNSI stood at negative 1.6 percent.

That is some 23 percentage points lower than where it is today. This contrast is not an encouraging sign, since it suggests that the average adviser considers the Dow Industrials at the 10,500 level to be less of a cause for concern today than six weeks ago.


A third - and related - storm cloud emerges when we contrast the stock market's current level with where it stood on March 15 - the last time the HSNSI was at, more or less, today's level. It turns out that the Dow Industrials on that day closed at 10,745 -- more than 200 points higher than where it closed on Monday.

This is a good measure of how much more bullish the average adviser has become.

Contrarians no doubt would differ over whether these brewing storm clouds are sufficient reasons in and of themselves to reduce equity exposures.

But they undoubtedly would all agree that it will be very crucial to see how advisers react to the stock market's next correction. If they are quick to jump back on the bearish bandwagon, then the rally's sentiment foundation will once again become strong.

But if they are hesitant to reduce exposure in the face of that correction, then the contrarian forecast will be for a return of bad weather.
 
Video

Thanks for posting the videos, very informative. Does anyone know how to obtain/build the 'squeeze' indicator that he uses? Thanks
 
Trading Shed said:
Thanks for posting the videos, very informative. Does anyone know how to obtain/build the 'squeeze' indicator that he uses? Thanks
you can go to their website & purchse the that indicator for $70-90.not sure.
 
Back
Top