Where is the Dow & others heading in 2005?

SOX on fire again, approx 5 points to key resistance of 200 week sma

It really needs to fail the 200sma. It can go above it but around that area it needs to fail...

Wait and see.....

Would have liked to short at around 10470-80 but missed it as I just popped out for 30 minutes. Come on creep back up.....
 
To give an idea of the significance of the MA, the SOX has only managed 3 weekly closes above that level since Aug '02 I think, and fell below the following week, bear in mid this a weekly MA and therefore intra-day and even daily violation is acceptable.
 
To give an idea of the significance of the MA, the SOX has only managed 3 weekly closes above that level since Aug '02 I think, and fell below the following week, bear in mid this a weekly MA and therefore intra-day and even daily violation is acceptable.

Thats my point.....we're allowed to make moves above but have to fail the area overall. RT would you be kind enough to post a chart in relation to your post.
 
user said:
It really needs to fail the 200sma. It can go above it but around that area it needs to fail...

Wait and see.....

Would have liked to short at around 10470-80 but missed it as I just popped out for 30 minutes. Come on creep back up.....


Seems that Du Pont is holding the Dow back. Both Nasdaq and S & P are positive. Having moved up 324 points in 3 sessions, I would think we should see at least some consolidation. It's one for the brave. Tomorrow is witching and as long as NYMEX Crude does not fall, I will be looking to get short around 10470 - 10500 for a intraday trade at least.
 
user said:
Thats my point.....we're allowed to make moves above but have to fail the area overall. RT would you be kind enough to post a chart in relation to your post.
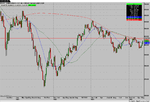
SOX weekly as requested and correction to my previos, the last close of more than one week was Jan '02 and as you can see that was not significant as the SOX had retraced the previous weeks move and closed right on top of the MA.
 

Attachments

  • snapshot-8.png
    snapshot-8.png
    39.1 KB · Views: 167
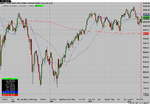
Now I'm going to be a real pain and ask if you could please post one for the Dow aswell. Thanks in advance!
 
Thanks....The 200 is not significant for the Dow as it is for the SOX...

I mean in terms of the past few years the SOX in relation to the 200 line is suggesting a sell very very soon...
 
User

do you have a target in mind if you did short at 10500?

Thanks

Rustic
 
Last edited:
do you have a target in mind if you did short at 10500?

An instant target of 10400 but thats because I haven't looked at the target as I've only just concluded to myself that it could well be the time to short now......

but I would definately think about shorting soon. VIX has come down too low levels as well. I really need to analyse more and then I'll post a more definative case. Probably be over the weekend.

Until then SHOULD we touch 10500 ( we may not) it'll most probably be brief so try and catch a short if you can or simply short near the current levels. I'm short at 10475 but thats just on the basis of 15min chart. I haven't entered a longer term short yet but will be looking too very soon. Maybe today, Friday or Sunday night. We'll see.

We've moved from around 10140 to nearly 10500. Around 360 for the week. Why does it seem so promising? It seems promising to the upside because we've gone up nice and quickly! Why have we gone up so quickly? Automatic stop loss trigers have helped greatly.....
 
user said:
Whats the consensus on the thread about the market? Racer, Kriseau you two seem to be bears that believe the bear trend has begun......Whats your views, please don't start to turn your positions into Longs as thats what the markets trying to do.... It painting this s**t picture that yes here we are moving towards 11,000 and before you know we'll be sitting at 10,000 again.

More views please about individual trader market stances please, because the moment most of you start to feel comfortable with longs then that'll be the time to short.

Don't call this a rally......call it a fake move up!

Racer two weeks ago you were suggesting about pumping a big short.......I did caution you according to my own analysis......You might aswell start accumalating your shorts because your sure getting good levels!

Major Failure area to watch: 😈 10490-500 😈

I said I was starting a swing short on September, still short and adding. vols on down moves in last few weeks more that upside and even yesterdays vol wasn't as high as some on the down moves.
I have plenty of time, it is several months till expiry, I am usually very patient with my Dow swing trades, so am not bothered at all by these intraday moves (that is why I want to open a futures account for short term trades, still adjusting to the program, paper trading and tweaking the settings)... look up close at intraday ticks and you can't see the wood for the trees as they say
 
look up close at intraday ticks and you can't see the wood for the trees as they say

Your true.....just start adding adding and adding as your short alone should make this market swing around 200points lower from current levels and thats what we need at the moment.....

Would I be correct in saying that your Stop losses are near the highs of the year?

Good Luck anyway.....
 
user said:
Your true.....just start adding adding and adding as your short alone should make this market swing around 200points lower from current levels..

Why do you think it isn't going up today 😉
 
Nas C 2035 is midpoint of total fall since Dec
So am watching the Nas for failure, might even short that again!
Nearly went long on it a while ago but missed it so didn't bother
 
NEW YORK (Dow Jones)--Philadelphia area manufacturers saw a sharp slowing in growth and employment gains in May, although the blow was lessened to some degree by a lessening in inflation pressures.
The Federal Reserve Bank of Philadelphia said Thursday that its business conditions index, a measure of the health of the region's manufacturing sector, stood at 7.3 in May, from April's 25.3 and March's 11.4. Readings above zero indicate expanding activity, and describe the breadth of the expansion, although not the size of the change in activity seen by individual firms. Economists had expected to see a reading of 19.

The Philadelphia Fed's report is one of the first releases of data detailing economic conditions during May. It follows the New York Fed's Empire State manufacturing survey from earlier in the week, which showed an unexpected contraction in activity. The ugly turn in the New York Fed's index had some forecasters worried that the Philadelphia survey would also be weaker than expectations.
 
ENS US-Economy : "Mortgage debt poses risk"
19-May-2005 13:32
Federal Reserve Chairman Alan
Greenspan again pushed for limits on
the multibillion-dollar mortgage
holdings of Fannie Mae and Freddie Mac,
saying such restrictions would not hurt
the thriving housing market.
Greenspan, who has been pressing
Congress to limit the holdings of the
two mortgage giants, warned today that
their debt poses a risk to US financial
markets.
As Fannie and Freddie grow ever
larger, their ability "to quickly
correct a misjudgment in their complex
hedging strategies becomes more
difficult," Greenspan said.
 
Every time it touches 10450 there is a quick volume spike to push it back up.
Be interested to see if it has a third shot at 10480 today or whether it starts to decline toward 10400 this afternoon.
 
One reason I am happy about shorts for Sept.. research jobs data..numbers usually strong around this time of year but then slows after this
 
Back
Top