Where is the Dow & others heading in 2005?

Bluewave said:
Hi Jilly, still long or have you cashed in? Probably they'll be a small movement back towards 10,200, and then further surges upwards for the rest of the week. My opinion anyway 😉

http://www.trade2win.com/boards/showpost.php?p=178069&postcount=4046

Hi there

No not long anymore. Got scared off yesterday when it couldn't get through 10200 and closed the trade at a lost. Then ended up kicking myself and wishing I had traded it as I said I would. Ah well. 🙄

I am now short at 10314. I expect the index will drop, but I'm not sure about 10,200 - I think it will - but can I add to this later when I've looked more at the charts after the market has closed for today.

Thanks 😀
 
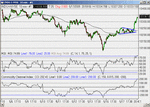
If you take today's action as a pennant (chart attached) then we are half way through a move and we should see 10400 - quite possibly tomorrow.

Not much room on 10 min RSI or CCI for more up so maybe a pullback first?

Looking back a few days 10400 was strong resistance so if we get there then it could be strong resistance again.

Happy trading!

Justyn.
 

Attachments

  • chart.gif
    chart.gif
    17.6 KB · Views: 176
'the Treasury Dept. said it may eventually name China as a manipulator of its currency, increasing pressure on China to revalue the yuan'

Well that is one way to move the Dow!
 
gmca686
"You've said it again, "CMC is biased to the upside" I'll repeat my previous reply. CMC is not biased at all. " i presume you use CMC as your SB company. i used to trade the DOW with CMC but i have now started to trade the DOW with IG Index. i use CMC for trading other instruments as they have the tighest spreads reflecting the instrument. but i personally found it difficult to trade the DOW using CMC as i found their prices biased. i dont look at YM. i look at the IG index quote, the DOW live and compare if their is a bias. for the last 2 weeks i have keeping a very close eye on the so called bias and only once it has not worked for me, maybe its a coincidence, ill found out soon 😕

when i say downward bias i mean their offer on the DOW is below the bid on IG index, and approx 6 points lower than the DOW live feed. if thats the case i go short. today there was no bias but the offer went higher than IG index sometimes or stayed the same. most of the time was higher than the live. obviously i do understand that they work on futures prices but i get the feel for how CMC move their prices when the dow goes up or down whilst keeping a close eye on volume NAs and other indicators. sorry if im not making sence but its working for me for the time being. i wont offent you again with the comment again😉
 
destiny said:
gmca686
"You've said it again, "CMC is biased to the upside" I'll repeat my previous reply. CMC is not biased at all. " i presume you use CMC as your SB company. i used to trade the DOW with CMC but i have now started to trade the DOW with IG Index. i use CMC for trading other instruments as they have the tighest spreads reflecting the instrument. but i personally found it difficult to trade the DOW using CMC as i found their prices biased. i dont look at YM. i look at the IG index quote, the DOW live and compare if their is a bias. for the last 2 weeks i have keeping a very close eye on the so called bias and only once it has not worked for me, maybe its a coincidence, ill found out soon 😕

when i say downward bias i mean their offer on the DOW is below the bid on IG index, and approx 6 points lower than the DOW live feed. if thats the case i go short. today there was no bias but the offer went higher than IG index sometimes or stayed the same. most of the time was higher than the live. obviously i do understand that they work on futures prices but i get the feel for how CMC move their prices when the dow goes up or down whilst keeping a close eye on volume NAs and other indicators. sorry if im not making sence but its working for me for the time being. i wont offent you again with the comment again😉

p.s. im only referring to the daily dow cash
 
Dow closed tonight at critical point, HPQ up in after hours but some economic figures tomorrow may be the decider on whether the downtrend since March is broken or if it fails at resistance.

Hmm, will I be a bull for a bit.. watch this space 🙂
 
Last edited:
Looks like you all had fun today - seems I picked the wrong evening for a round of golf! Thought about setting a buy limit order at 10260 before I went out but didn't want to do it without being able to watch the action. Bugger.

SQ
 
Destiny,
I understand where your coming from on comparing IG and CMC. There was a thread about a year ago when some posters implied that CMC ran their Dow quotes above or below the Dow cash price depending on whether they thought the market was going up or going down. This was described as the D4F SB bias. I tried to point out that the prices were set by the Dow Futures prices and there was no "bias" as such.
No offence taken by your post, I hope my reply didn't come across as "sharp"
regards, G McA
 
What about Finspreads - any idea whether they have a bias on the daily futures? I tried asking them last week, but whoever I spoke to either didn't understand the question, or pretended that he didn't.
 
At last accumulation days across the board, SPX, COMPQ and INDU closed higher and on higher volume. Volume in the Nasdaq cqme in approximately 11% higher, while volume in the NYSE only managed 1% increase. Internals finished strong on the NYSE but lacklustre on the Nasdaq. Gains were attributed in part to more pressure by US on China to float its currency. As a casual observation, it seems a bit odd to go to such lengths to p*ss off someone who finances so much of your debt, but there ya go.

INDU is now up against a trendline from the highs in March, overhead it has the area that provided prior support in Jan and Mar and resistance at the beginning of May, 10,360 - 10,400.
Also converging in this area are both the 50 and 200 day sma.

SPX closed right at the down trendline from Mar which has converged with the 50 day sma, above that 1178 would be the next target I see, which is an up trendline from Aug '04 and the last swing high.

COMPQ managed to close above both its down trendline from Jan and the 200 day sma. It also managed to close above the psycological 2000 level. Next target on the upside would be the last swing high at 2021 and an open gap from early Mar at 2028
 
RT thanks for informing us of the volume action. I posted yesterday that we should see 10400 and yes I still see us moving towards 10400. FC hope you still had your longs worked out well in the end...

10400 instant target.
 
roguetrader said:
Gains were attributed in part to more pressure by US on China to float its currency. As a casual observation, it seems a bit odd to go to such lengths to p*ss off someone who finances so much of your debt, but there ya go.

Yes I would agree with you there and was rather surprised at the comments.. if I was China I wouldn't be too pleased and would feel like telling them to .... ....
 
roguetrader said:
At last accumulation days across the board, SPX, COMPQ and INDU closed higher and on higher volume. Volume in the Nasdaq cqme in approximately 11% higher, while volume in the NYSE only managed 1% increase. Internals finished strong on the NYSE but lacklustre on the Nasdaq. Gains were attributed in part to more pressure by US on China to float its currency. As a casual observation, it seems a bit odd to go to such lengths to p*ss off someone who finances so much of your debt, but there ya go.

INDU is now up against a trendline from the highs in March, overhead it has the area that provided prior support in Jan and Mar and resistance at the beginning of May, 10,360 - 10,400.
Also converging in this area are both the 50 and 200 day sma.

SPX closed right at the down trendline from Mar which has converged with the 50 day sma, above that 1178 would be the next target I see, which is an up trendline from Aug '04 and the last swing high.

COMPQ managed to close above both its down trendline from Jan and the 200 day sma. It also managed to close above the psycological 2000 level. Next target on the upside would be the last swing high at 2021 and an open gap from early Mar at 2028

RT - I don't know what the basis of your volume comparison figures are but trading volumes on the Dow and the Nasdaq have been 10% lower during the recent upturn in the indicies than they were during the April downturn. This suggests that some of the previous sellers have just been sitting on their hands.

I agree with you that resistance at 10400 will be a tough nut for the Dow to crack and it could prove to be the ceiling on this current bull rally. Problem is that the markets are so jittery that they can easily spike up or down on a daily basis according to the latest company report or piece of economic data. In that context, todays April CPI will probably provide the main stimulus to the market in either direction.
 
fridayeve said:
I doubt that luck had anything to do with your correct analysis of the DJ, I would expect that you came to your view of where the market was heading by correctly spotting the various elements that you have learnt to recognise over time. So although I recognise your modesty, there is no doubt that if you remain focused and determined enough together with the right guidance periodically, there will be continued progress. That is providing of course that you choose your advisers very carefully so as not to stray too far from reality.
Just for the sake of interest, as you know nothing is cast in stone, I might also expect to see 10300 indeed 10320 is not impossible, dependant on the early signs at start. If 255 is breached with real support, however the professionals will decide!
Have a good day, kind regards.

good call friday or did you go for your picnic (re 4140)???
 
kriesau said:
RT - I don't know what the basis of your volume comparison figures are but trading volumes on the Dow and the Nasdaq have been 10% lower during the recent upturn in the indicies than they were during the April downturn. This suggests that some of the previous sellers have just been sitting on their hands.

I agree with you that resistance at 10400 will be a tough nut for the Dow to crack and it could prove to be the ceiling on this current bull rally. Problem is that the markets are so jittery that they can easily spike up or down on a daily basis according to the latest company report or piece of economic data. In that context, todays April CPI will probably provide the main stimulus to the market in either direction.


The volume comparisons I refer to are done on a day by day basis, comparing the volume to the previous day. An accumulation day is simply defined on price closing higher than the previous day and on higher volume than the previous day and vice-versa for a distribution day.

Your obsevation is quite correct, volume for the large part remains below the 60 day ma which is widely watched as an indicator for institutional participation, as a result the fluctuations can be viewd with some scepticism. I have simply presented the data for people to draw their own conclusions, the charts I have posted go back to mid April. By and large IMHO institutions have the market banded between about 10,550 and the years lows and I doubt we will see a significant and sustained pickup in volume until those levels are reached..
 
Still another reasonable trade for the evening trader with patience to sit and wait for breakouts (Tuesday evening)
 
Problem is that the markets are so jittery that they can easily spike up or down on a daily basis according to the latest company report or piece of economic data. In that context, todays April CPI will probably provide the main stimulus to the market in either direction.

Very true kriesau, and imho this is compounded by the low volume as it takes very little to pump or dump the markets.
 
WASHINGTON (MarketWatch) -- The Bush administration has given China six months to take a concrete, large step toward a flexible exchange rate.

In its semiannual currency report released Tuesday, the Treasury Department did not make a formal finding that the Chinese government manipulated the exchange value of the yuan for export advantage.

But the report warned China that it has six months, until the next currency report is due, to move to a more flexible exchange rate or be designated as a currency manipulating country.

"If current trends continue without substantial alteration, China's policies will likely meet the statute's technical requirements for designation," Treasury said. Read the full report.
China
 
Racer,
What’s the difference between “a currency manipulating country” & a country that manipulates the stock markets?
 
Back
Top