You are using an out of date browser. It may not display this or other websites correctly.
You should upgrade or use an alternative browser.
You should upgrade or use an alternative browser.
Where is the Dow and Mothers heading in 2006?
- Thread starter tradesmart
- Start date
- Watchers 15
tradesmart
Experienced member
- Messages
- 1,286
- Likes
- 22
Friday:-
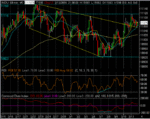
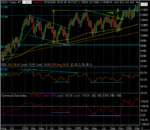
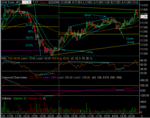
Technically, it was a nice short setup with an early 3-peak negative divergent RSI top, confirmed by crossover of the 9/16 period SMA’s and a gap fill target…(5 min chart attached)
I suspect that there could be more upside to come to equal the recent 11160ish highs, but there is a slew of market moving data this week, and the index could still be vulnerable to a rollover.... 😉
An inconclusive outcome yesterday with an early foray north of 11100 which stalled, followed by a steady all day long pullback, apparently due to increasing oil$$ and treasuries yields..(the usual suspects..!)Clearly a break above the top trendline at 11100 is required to maintain bullish momentum and break the downtrend……or rollover ....(again..!)
Technically, it was a nice short setup with an early 3-peak negative divergent RSI top, confirmed by crossover of the 9/16 period SMA’s and a gap fill target…(5 min chart attached)
I suspect that there could be more upside to come to equal the recent 11160ish highs, but there is a slew of market moving data this week, and the index could still be vulnerable to a rollover.... 😉
Attachments
leovirgo
Senior member
- Messages
- 3,161
- Likes
- 156
Good call. It was unexpected move for me.tradesmart said:I suspect that there could be more upside to come to equal the recent 11160ish highs, but there is a slew of market moving data this week, and the index could still be vulnerable to a rollover.... 😉
mark twain uk
Established member
- Messages
- 618
- Likes
- 4
tradesmart said:Friday:-
I suspect that there could be more upside to come to equal the recent 11160ish highs, r.... 😉
Hear, hear, very good call indeed
tradesmart
Experienced member
- Messages
- 1,286
- Likes
- 22
Thanks Guys...!....I got lucky.....!!.. 😉
The call was mainly based on the observation that if the index makes a 'high' it usually likes to come back to retest it, sometimes after a very considerable pullback......and the chart geometry looked right....
Where to now...?...well, we're at prior resistance so maybe we can expect some degree of pullback, but I don't see a 'proper' top in the larger timeframes, so more upside to come? - time will tell...... 😎
Attachments
counter_violent
Legendary member
- Messages
- 12,672
- Likes
- 3,787
tradesmart said:Thanks Guys...!....I got lucky.....!!.. 😉
The call was mainly based on the observation that if the index makes a 'high' it usually likes to come back to retest it, sometimes after a very considerable pullback......and the chart geometry looked right....
Where to now...?...well, we're at prior resistance so maybe we can expect some degree of pullback, but I don't see a 'proper' top in the larger timeframes, so more upside to come? - time will tell...... 😎
Given the channel trendline break and subsequent re-test of the break... i'd say there will be a push upwards from here......what say you ?
Hi All,
Its been a long while since I last posted.... been travelling, new job etc... But have been keepin an eye on the board. Nice to see a few new bodies and of course the old ones. (My Username changed). Disapointed to see a few of my fav posters have disapeared but probably due to 1 of 2 things. They have been soo successful last 6 months that they are sitting on some beach sipping singapre slings, or they have been wiped out and given trading the heave ho. Personally I think the second reason is more likely as I have been quite successful last 6 months but dont think I could give up trading whatever figures I had in my bank account.
Right enough philos talk... lets get dwn to business.
Today.... Dwn day. We are forming(ed) a major toping of the Index... I see this not only on Dow but FTSE, DAX. I think the hitting of 11160 yesterday was critical to form this major top... (Double top). If I was honest I would say that I was expecting a diverging top... hence my entry levels of my shorts, but in the long run double top is a lot better.
Was slightly annoyed yesterday that I had jumped on the shorts too early but hey if anyone trades the markets using almost exclusively volume like I do, you will know that the last two days was almost impossible to ascertain a level for entries due to the such low volume, and the VMA spikes followed by a tight consolidation within 10-20 points to level of the VMA again.
Again the low volume that has seen this push higher is another warning sign for you bulls.
Downside..... I dont quite see the 400 point drop in the next week or so like some bears due to the huge buying surges that occurred last week at levels 10920 - 60, but hey thats another 200 points down and could all be down to this Friday (Options expiration day - big players protecting their positions!!!)
After Friday, it could be a whole new market going down, down, down once the options have expired, and the institutions probably renew their contracts at level 10500.
Anyway thats my 2 bit for today.. have a good trading day... ( Feel for you MOMBASA but you should be ok if you still short. Am sure you will be able to come out equal in next couple of days!!)
tradesmart
Experienced member
- Messages
- 1,286
- Likes
- 22
Last night:-
Maybe there’s reason to be suspicious about these big moves in options expiration week – are the big options houses manipulating the market to shaft the put holders….?…..maybe, but it creates extremely tradeable moves…!
A good time to ruminate on the Dow’s progress as shown on the bigger pictures….
Great honk chart…
1300 triangle chart….
And the 11200 target…..now hit…
The outlook seems bullish for now…
No, and another ‘up’ day with an early bullish looking consolidation in a tight range and a nice breakout to trade at the 14.00EST ‘magic moment’ on the beige book news – the kind of obvious aggressive buying you can jump into with confidence for a decent ride up….. 😎I don't see a 'proper' top
Maybe there’s reason to be suspicious about these big moves in options expiration week – are the big options houses manipulating the market to shaft the put holders….?…..maybe, but it creates extremely tradeable moves…!
A good time to ruminate on the Dow’s progress as shown on the bigger pictures….
Great honk chart…
1300 triangle chart….
And the 11200 target…..now hit…
The outlook seems bullish for now…
Attachments
leovirgo
Senior member
- Messages
- 3,161
- Likes
- 156
Our conversation when Dow was around 10700. It isn't the top yet. But corrective swing is not far away IMO.tradesmart said:Yes Leo, the 11200 target keeps coming up in t/a calcs - maybe it'll get hit soon...!.... 😎
tradesmart
Experienced member
- Messages
- 1,286
- Likes
- 22
I suspect that you’re right Leo….It isn't the top yet. But corrective swing is not far away IMO.
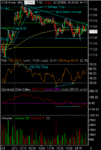
The smaller picture:-
Another bullish day with a gap-up open, but the index spending the day pinned between the 11320/360 pivots forming what looks like a small H&S…
My speculative target for tomorrow is a 50ish point pullback from current levels to fill the gap and see what happens from there….
Also note the rising maroon coloured trendline which originates from the higher low at 11050 – if this is broken, a more severe pullback could result….
Tight stops are mandatory in this ‘game’ though, and I won’t be giving it a chance to waste my account if I’m wrong….... 😉
(nb - the futs are about 80 points ahead of the cash at the mo'..)
Attachments
macbonzo
Well-known member
- Messages
- 292
- Likes
- 6
baifriend said:80 point futures premium is a big burden for longers to roll forward.
Is it a bonus for shorters?
Yeah, a very good point, which people tend to forget when switching to JUN06 contract
tradesmart
Experienced member
- Messages
- 1,286
- Likes
- 22
Last Night:-
More of the same, sideways - an inside day, defying gravity…... 😕
“consolidating at the highs” is probably the expression….
Obviously the big boyz had an interest in keeping it up during options expiration ….all the volatility worked out in the lead-up this week.....or maybe it's the St Patrick's Day effect.?! 😆
A break of the trendline and a rise to test prior support as resistance, so an almost inevitable push to the downside to fill the gap will have to wait until next week imho
the index spending the day pinned between the 11320/360 pivots
More of the same, sideways - an inside day, defying gravity…... 😕
“consolidating at the highs” is probably the expression….
Obviously the big boyz had an interest in keeping it up during options expiration ….all the volatility worked out in the lead-up this week.....or maybe it's the St Patrick's Day effect.?! 😆
A break of the trendline and a rise to test prior support as resistance, so an almost inevitable push to the downside to fill the gap will have to wait until next week imho
Attachments
tradesmart
Experienced member
- Messages
- 1,286
- Likes
- 22
Friday:-
More of the same today..
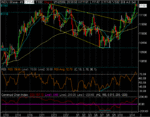
But not a bad day if you’d taken the first short from 11390 – 340 (futs) and run with your 50 points bagged in an hour, as the rest of the day became a whipsaw trip to nowhere……..
The 50 point triangle formed over the course of the day gives a hint of a 50 point move from the breakpoint when the market has digested the meaning of Uncle Ben’s rhetoric which occurs later today….
I suspect we might see a mild retracement south, but beware, it could go the other way if Ben says the ‘right’ things…..this is a bull market!….….and the news calls the shots..
On the bull note, the daily chart offers the prospect of more upside to come if the measured move plays out to target, and they very often do….. 😉
“consolidating at the highs” is probably the expression….
More of the same today..
But not a bad day if you’d taken the first short from 11390 – 340 (futs) and run with your 50 points bagged in an hour, as the rest of the day became a whipsaw trip to nowhere……..
The 50 point triangle formed over the course of the day gives a hint of a 50 point move from the breakpoint when the market has digested the meaning of Uncle Ben’s rhetoric which occurs later today….
I suspect we might see a mild retracement south, but beware, it could go the other way if Ben says the ‘right’ things…..this is a bull market!….….and the news calls the shots..
On the bull note, the daily chart offers the prospect of more upside to come if the measured move plays out to target, and they very often do….. 😉
Attachments
tradesmart
Experienced member
- Messages
- 1,286
- Likes
- 22
Something for both the bulls and the bears today……
Looks like the big boyz wanted to pump it up high to dump it….!
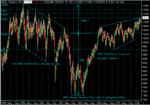
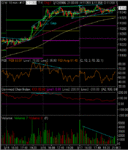
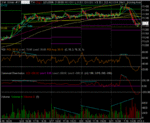
A 60 point pump followed by a 100+ point dump from the 11410 top, and a concerted effort to fill the gap at 11295 in the last hour…it was bound to be remembered… 😉
Notable that when the ‘sell’ algorithm cuts in there is negligible effective buying whatsoever – straight through previous support levels…!
Where to now…? - ‘round trips’ suggest the likelihood of triangle to follow / a lower high / retest of the prior support line as resistance….I doubt that it will go straight down from here...
The institutions have had a good run up this year, and may want to keep the indexes high going into the quarter end.....
Attachments
TS, did u spot the bounce of the upper trend line on the daily on the cash?
Interesting times ahead. If the bounce continues then 11,700 beckons and higher - much higher.
I'm now beginning to think about joining the bulls 🙂
Now, how does one get on the right side?
Interesting times ahead. If the bounce continues then 11,700 beckons and higher - much higher.
I'm now beginning to think about joining the bulls 🙂
Now, how does one get on the right side?
tradesmart
Experienced member
- Messages
- 1,286
- Likes
- 22
Now, how does one get on the right side?
Mom, if I knew the answer to that one and could sell it.....!.... :cheesy:
I reckon that the market focus short term is the FED rates meeting on the 28th, and ahead of that we're going to see consolidation of recent gains; maybe a large triangle or similar......
I suspect that the market will go higher, but later when the rates outlook is clearer...
(and if oil hits $80/b, all upside bets are off...... 😉 )
tradesmart said:I reckon that the market focus short term is the FED rates meeting on the 28th, and ahead of that we're going to see consolidation of recent gains; maybe a large triangle or similar......
A large triangle would be good - very tradeable. Just have to spot it early 🙂
tradesmart
Experienced member
- Messages
- 1,286
- Likes
- 22
Last Night:-
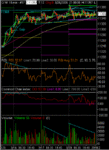
Not a bad day if you’d held long overnight from the 11295 gap-fill low PD RSI bottom, or got on board at the 9/16sma cross-over at the open believing that a 50 or 61.8% fib retracement of yesterday’s fall was possible (it of course well exceeded that…!)
A slow creep upwards retracement day forming a classic 3-peak rising wedge pattern until the 14.00hr ET ‘magic moment’ when the sell algorithm cut-in for a sharpish 30 point move to the downside, which looked promising for the bears but didn’t develop, soon bouncing back off the 100ema for a 50 point rise virtually erasing all of yesterday’s losses….
More volatility in the developing range to come imho….
All there today….a speculative triangle forming..Where to now…? - ‘round trips’ suggest the likelihood of triangle to follow / a lower high / retest of the prior support line as resistance….
Not a bad day if you’d held long overnight from the 11295 gap-fill low PD RSI bottom, or got on board at the 9/16sma cross-over at the open believing that a 50 or 61.8% fib retracement of yesterday’s fall was possible (it of course well exceeded that…!)
A slow creep upwards retracement day forming a classic 3-peak rising wedge pattern until the 14.00hr ET ‘magic moment’ when the sell algorithm cut-in for a sharpish 30 point move to the downside, which looked promising for the bears but didn’t develop, soon bouncing back off the 100ema for a 50 point rise virtually erasing all of yesterday’s losses….
More volatility in the developing range to come imho….
Attachments
Similar threads
- Replies
- 8K
- Views
- 952K
- Replies
- 0
- Views
- 3K

