Where am I going wrong?

new_trader said:
Sorry, I understood you the 1st time, perfectly clear. I was asking how YOU determine YOUR trade entries? You said you don't use indicators meaning not even Volume?

Everything that you explained after the trade makes perfect sense to me. My question/problem is that if you were looking at the chart in real time, how can you be confident that 6 will make a new high where 2 failed?Why wouldn't you wait until it broke above the peak after 4? Do you follow what I mean?

Well, it's your journal, and you look at a great deal more than I do, so how I determine my entries is not necessarily pertinent to what you're doing.

But.

Assuming that I'm looking at the open and assuming that I didn't go short at that point and assuming that I know nothing about the average daily range of this product, I'd look at that 10m pause at 1373. I might go short on the underside depending on how the bars "moved". But I'd be out immediately when sellers showed that they were unable to withstand demand.

Might I then go long? I might, given that the downside was rejected for now. But, again, I'd be out very quickly when TrAc remained subdued. If, for some reason, I were to stay in, I'd be out just below 2.

As for 6, you don't know; you assign probabilities. When price slammed into 4, it immediately and strongly rebounded, i.e., buyers came in took control, at least for a moment. Price then retested this level, cautiously, taking its time. And when it hit the lows at 5, it pulled back, like touching a hot stove. Then it repeated the action. Then buyers took the reins and pushed price up past 1369. And even though price dropped back a tick or two, TrAc was very light (or seems to be; your volume is very scrunched down). So, if a stop limit buy is placed above all of this and buyers are in fact exercising their muscles, you'll be stopped into the trade. If sellers are still in control, you'll either be out very quickly or not in at all.

If you're looking at pivot points and Fib levels and DOM and a variety of other things, you may not see any of this. But this is how I trade.

As for waiting until price exceeds the swing point after 4, sure. But by then, it's obvious, and you're as likely to get faded as supported. If you're already in the trade, you're already in the profit column when others finally wake up and start buying, and you also have a cushion in case price gets faded.

The more confirmation you want, the more risk you're going to have to assume.

Db
 
Incidentally, I also incorporate support and resistance, but since I don't know the pre-chart context, I can't include that here.
 
dbphoenix said:
The more confirmation you want, the more risk you're going to have to assume.

Db

sorry for intruding your journal, and sorry for quoting DB,

but, to be honest, the phrase above is worth giving it serious thought IMO

j
 
jacinto said:
sorry for intruding your journal, and sorry for quoting DB,

but, to be honest, the phrase above is worth giving it serious thought IMO

j

Actually, it's Wyckoff . . . :)
 
well, it most certainly is a phrase to keep in mind. full of meaning.

( if I said sorry for quoting you, what I meant was "sorry to create a discussion within somebody elses journal").
 
jacinto said:
well, it most certainly is a phrase to keep in mind. full of meaning.

( if I said sorry for quoting you, what I meant was "sorry to create a discussion within somebody elses journal").

By all means, quote me. But I should have given credit where credit was due in the first place.

As for the "Day Trader's Bible", I posted the pdf of it here:

http://www.trade2win.com/boards/showthread.php?p=275587
 
thank you. I shall have a proper look during the weekend.


Newtrader, apologies again. Should I delete my posts from your journal, please say so. sorry again.
j
 
jacinto said:
thank you. I shall have a proper look during the weekend.


Newtrader, apologies again. Should I delete my posts from your journal, please say so. sorry again.
j


No apology required, your input is welcome. That goes for everyone as long as it doesn't involve flaming other posters. I will not tolerate any of that.
 
I have taken your original chart and tried to talk through some of the things that occur to me.
Not everyone will have the same view but I hope it helps.

When you see a lower high, it should set off warning signals.
When the market corrects for the second time and breaks the original pull back its time to get out. (especially after the backtest.

If you are not going to reverse and go short, than wait for the break of trend line and try again.


eshzh1.gif
 
DoubleSix said:
I have taken your original chart and tried to talk through some of the things that occur to me.
Not everyone will have the same view but I hope it helps.

When you see a lower high, it should set off warning signals.
When the market corrects for the second time and breaks the original pull back its time to get out. (especially after the backtest.

If you are not going to reverse and go short, than wait for the break of trend line and try again.


eshzh1.gif

Essentially what I wrote earlier, put in a different way (glad to see I'm not the only one who views events in this manner), but D6 mentions the break of the trendline. This is how I used to play this sort of setup back when volatility was higher and I was more conservative. And one can still play it this way. But, again, the more information one requires, the more risk he assumes. In this case, buying after the break of the TL supposedly brings a bit more assuredness that the reversal is good, but the entry is farther away from the stop. This can lead to nervousness when price doesn't take off as expected (or, perhaps more accurately, hoped for).

So you pays your money and you makes your choice.

Db
 
db
I would suggest that after a break of TLine, you may be putting your stop in the 'wrong' place.

In this situation, the stop should be at the level of the TLine break, subject only to the possibility of a 'backtest'.

Then if you get hit, you know almost immediately that it was a false break and little damage is done.
 
DoubleSix said:
I have taken your original chart and tried to talk through some of the things that occur to me.
Not everyone will have the same view but I hope it helps.

When you see a lower high, it should set off warning signals.
When the market corrects for the second time and breaks the original pull back its time to get out. (especially after the backtest.

If you are not going to reverse and go short, than wait for the break of trend line and try again.


eshzh1.gif

Thanks DoubleSix. I have saved your image and will study it along with Dbp's image. Fantastic input so far.
 
hornblower said:
you are trading in a very short time frame ,
try 5 min, 15 min ,and 60 min charts

I don't see any problem in trading in such a short time frame of 1 minute, and increasing the timeframe is not a direct link to a higher chance of improvement.

I certainly agree that looking at the 1440, 60 etc. (multi time frame confirmation) should help. i.e. perhaps not trading against the hourly-daily candle directions (??)

As has been suggested and done, looking at the chart and annotating it in terms of LL, LH, HH & HL should be a big help.
 
But I am aiming to understand what is going on rather than just doing what is advised. ie/ Am I a weak hand being slaughtered by the strong hands?

There are times when the big players do look to take out those who are under capitalised but
they are few and far between. Psychologically, you should assume it doesnt happen otherwise you will be looking under every stone and finish with 'rats in your skull'.

Just set your own rules and play your own game.

Understanding just what is going on comes with experience and observation.
And even then do not expect to get it right very often.

There are times when markets are fairly predictable (but only for a while) but most of the time
you will be hard put to understand its gyrations.
There are simply too many factors which affect market movement in the 'medium' term.
 
JTrader said:
I don't see any problem in trading in such a short time frame of 1 minute, and increasing the timeframe is not a direct link to a higher chance of improvement.

I certainly agree that looking at the 1440, 60 etc. (multi time frame confirmation) should help. i.e. perhaps not trading against the hourly-daily candle directions (??)

As has been suggested and done, looking at the chart and annotating it in terms of LL, LH, HH & HL should be a big help.


trading the 1minute is neither good or bad. it really depends.

if you only trade on the 1 min bar, dont expect to get the big moves (sometimes you will), but also expect to have significantly lower risk (tighter stops, that are trailed close behind relevant HL or LH as the case may be)

if you trade the 1 min bar to get entries based on say, the 60 min bar or 240 min bar, then this is a different ball game with Risk-reward.

my point is that in either case risk-reward should be in line with the plan-timeframe approach (assuming the above is a short very short version of a plan)

and yes, absolutely, LL LH etc. are key, as support resistance are.

anyway, just an opinion.

j
 
NEW T
I posted the same chart for you yesterday on your earlier post to the psycho thread. I removed it because it is a psycho thread and not a tactical thread.
My points to you were nearly the same as have been made.
If you have to take a bottom picking strategy (reversal) with a resistance overhead as was the case here. Consider this...wyckoff ..cause and effect...with such a small causual area what extent of effect were you planning for ?...on your chart I would suggest it would be encompassed by the plan to exit half at resistance and trail half to exit at a 50% retracement which would actually be the same exit on the stop as already posted by me and by D6....in other words the plan is an in and out with the option of allowing half to run if R is taken out.. The most probable time that that would occur is with a V bottom which is not the most common type..so immediately you are bucking the odds...... this was the basis when I posted my former comment about "trade selection" ,but I could have added even with that selection you could have finished ahead with the right tactics to suit that setup....if this is a surprise then you might have another look at the probabilities of this particular setup.
For further insight into this tactical area I think you would benefit from reading Graifer & Schumacher.
 
Last edited:
Lessons Learned?

Ok. Using the lessons learned so far I made the following trades last night/this morning.

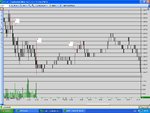
Image ES_2007-06-03-001.jpg is trade 1.

1) Short 1397.75 with STOP at 1398.75
2) STOP Trailed to 1396.5
3) STOP HIT for Gross Profit of 1.25 points

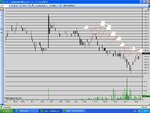
Image ES_2007-06-03-002.jpg is trade 2.

4) Re-entered a Short at 1394.5 with STOP at 1395.5
5) STOP Trailed to 1394.25
6) STOP Trailed to 1394.00
7) STOP Trailed to 1393.75
8) STOP Trailed to 1393.50
9) STOP Trailed to 1392.75
10) STOP Trailed to 1392.50
11) STOP Hit 1392.50 for Gross Profit of 2 points

I didn't make another trade as I would like some more feedback. I like trading out of Cash Market hours for the moment because it is almost like trading in slow motion. I may continue until my confidence/Proficiency improves.

All comments/Criticisms welcome and appreciated.

Also, (I think it was Dbp's suggestions) I bought an Olympus WS-320M Digital Voice recorder to record trading notes. It may or may not prove beneficial but in any case I always wanted one and it also plays MP3's! I still havent taken it out of the box so don't ask me about it yet.


I cannot express my gratitude enough. I don't have a trading mentor so I rely heavily on this board. Thanks again to all.
 

Attachments

  • ES_2007-06-03-001.jpg
    ES_2007-06-03-001.jpg
    151 KB · Views: 303
  • ES_2007-06-03-002.jpg
    ES_2007-06-03-002.jpg
    167.9 KB · Views: 283
chump said:
NEW T
I posted the same chart for you yesterday on your earlier post to the psycho thread. I removed it because it is a psycho thread and not a tactical thread.
My points to you were nearly the same as have been made.
If you have to take a bottom picking strategy (reversal) with a resistance overhead as was the case here. Consider this...wyckoff ..cause and effect...with such a small causual area what extent of effect were you planning for ?...on your chart I would suggest it would be encompassed by the plan to exit half at resistance and trail half to exit at a 50% retracement which would actually be the same exit on the stop as already posted by me and by D6....in other words the plan is an in and out with the option of allowing half to run if R is taken out.. The most probable time that that would occur is with a V bottom which is not the most common type..so immediately you are bucking the odds...... this was the basis when I posted my former comment about "trade selection" ,but I could have added even with that selection you could have finished ahead with the right tactics to suit that setup....if this is a surprise then you might have another look at the probabilities of this particular setup.
For further insight into this tactical area I think you would benefit from reading Graifer & Schumacher.

Appreciate this but at the moment I am only trading 1 contract so I don't have the option to exit half positions.
 
The only feedback I have is "well done".

glad to see in the second chart that you had the patience to wait for the 'real' lower high before entering.

The most important concept to get across is that you must not feel "ownership" of your decision to enter a trade. You are playing a game of numerics only. So dont let a profit turn into a loss because you think you are right and the market is wrong.
Always ALWAYS aim to take some money off the table .
 
you could also consider that 90%+ of amateurs lose, give up now, and find something more profitable to do
 
Top