Weekly forecast for S&P 500 cash 2011

1155 for me this week please Pat

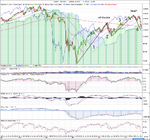
I'm still optimistic and think we are in an wave 4 down phase currently from the March 09 low, which has been extended more than it usually would by the panic caused by the US downgrade shock a few weeks back and European banks crisis. So my theory is that we are going to have another run up (Wave 5) that could start soon. One reason for this could be politics as I don't think the Obama administration would want a bear market during an election campaign so will be keen to get things ticking up again soon. And the other reason is that a lot of money managers will likely have underperformed this year because of the volatility, so will be keen to start buying soon to try and get a return before the end of year IMO. Historically this doesn't usually happen until the end of October though as November and December are normally two the strongest months.

Attached is my long term chart
 

Attachments

  • SP500_weekly_20-8-11.png
    SP500_weekly_20-8-11.png
    89.5 KB · Views: 191
With panic playing out, no doubt there´s still room down further. Picking a number out of thin air, would be 1060 for next friday close.
 
nice to see another fan of Ichimoku Kinko Hyo :smart:

I think it's a great tool for long term analysis and identifying trends on indexes, so I always keep an eye on it. I find it less useful on individual stocks though especially on shorter time frames, so I stick to using it for longer term views mostly on the major indexes and commodities.
 
I think it's a great tool for long term analysis and identifying trends on indexes, so I always keep an eye on it. I find it less useful on individual stocks though especially on shorter time frames, so I stick to using it for longer term views mostly on the major indexes and commodities.

for stocks i like them on a daily TF for option trading
 
average = 1105
wt av = 1098
up = 4
down =10

highest = 1247
lowest = <1000

:clover:
 
* U.S. shares were set to fall on Wednesday, giving up some of the hefty gains of the previous session, which were based on hopes that Federal Reserve chairman Ben Bernanke will announce measures to stimulate the struggling U.S. economy

* At 0847 GMT, futures for the S&P 500 (SNP: ^GSPC - news) Dow Jones (DJI: ^DJI - news) and Nasdaq 100 (Nasdaq: ^NDX - news) were down between 0.7 and 0.8 percent.

* Bernanke speaks to a central bank conference on Friday in Jackson Hole, Wyoming. Analysts and commentators are divided on how much scope he has to announce further stimulus measures.

* The FTSEurofirst 300 index of leading European shares was up 0.3 percent at 927.00 points.

* Heineken NV , the world's third largest brewer, fell 12.3 percent after first-half profit came in below forecasts and it said volumes in Europe (Chicago Options: ^REURTRUSD - news) and the United States would suffer from economic uncertainty.

* The Nikkei stock average fell 1.1 percent on Wednesday as Moody's Investors Service's downgrade of Japan (NYSE: MCO - news) 's sovereign debt rating spurred investors to take profits, erasing intraday gains made on speculation of more U.S. easing.

* Orders for cars and planes probably helped U.S. durable goods orders rebound. After a disappointingly week June, orders likely rose 2.0 percent, reversing the prior month's 1.9 percent decline. Data for July is due at 1230 GMT.

* Quarterly profit at Applied Materials (NasdaqGS: AMAT - news) is expected to increase to 33 cents per share, 4 cents per share better than the same period one year ago. The chip-manufacturing equipment maker last month said tough economic conditions in Europe and the United States were hurting demand.

* U.S. stocks shot higher on Tuesday on speculation Bernanke this week would signal new help for the economy, giving investors hope a four-week rout was nearing an end. Weak data in housing and regional factory activity triggered the latest round of bets that Bernanke will act, even though the Fed's options appear limited.

* The Dow Jones industrial average rose 3 percent; the Standard & Poor's 500 Index rose 3.4 percent; the Nasdaq Composite Index rose 4.3 percent.

* A strong earthquake rattled the U.S. East Coast on Tuesday, sending tremors as far as Canada, damaging well-known buildings in the nation's capital and sending scared office workers into the streets. (Reporting by Brian Gorman; Editing by Hans-Juergen Peters)
 
For Week Ending Friday 26th August at 1176.8

Name.............Call.........Direction.......Podi um .........sub Total……………Total

Pat494……………..1070……..…..0…………….…….0…………………….0…………….… . ...12
Gaffs1964………..1091…………..0……………...….0…………….……..0………… … … .…..11
robster970……….1080……………0………….….……0…………………….0…………..… …. ..11
wackypete2.…….1133……………1……….…….……1……….………..…2………….… … …….9
Atilla………………..1180………….1……………….…..3…………………….4……………… … … 8
Isatrader………….1155.….………1……………….….2…………………….3………………. … ….7
dpinpon..........1060..........0.................0.. ...............0..................5
Av…………………….1118…….…….0…………………...0…………………….0…………. .. …. …5
Rathcoole exile..1076.........0.................0............ . ..0...................5
Wt av………….....1098.………..0…….…….………..0………………..….0……… .… … …… ..3
Tim3..............1107.........0.................0. ................0..... ..............2
debrox............1247.........1................0. ................1....................1
DonStar..........1101..........0................0.. ...............0....................0
Icchong76……….<1000………….0…………………..0……………………..0………………………..0

Our winner this week is Atilla, so many congrats to you. The markets were more stable last week, perhaps waiting on Bernanke to speak. The crisis doesn't seem to be going away though.
Strong analysis needed for next week.

:clap:
 
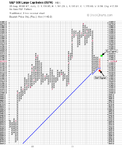
The combination of the divergences in the short term indicators and the fact that we were at the long term 50% fib level from the 2007 highs to 2009 low got me on the right side of the market for a nice change last week. So I'm going to stick with the up move this week as there are other positive signs in the breadth indicators I follow. I've attached the S&P 500 percentage of stocks above their 50 day moving average, which had a double top buy signal on the 24th. The other slower ones are still negative but a few up days could change that as they are close to break out points.

However, the S&P 500 is at a critical point as it has formed a triangle consolidation pattern on the point and figure chart. Triangle patterns often lead to fast moves in either direction so I'm going to watch for break above 1200 or break below 1120, which would be worrying as it would break below the long term up trend line that's been in place for over 2 years.

But I'm still feeling positive, so I'm going to stay with the up move from last week as I think if we break above 1200 then we'll move up quickly to the next resistance zone between 1230 and 1270, but as the long term 61.8% fib level is around 1230 I think that would be a good place for the market to settle at the end of the week.

So 1230 for me next week please Pat.
 

Attachments

  • SP500_PnF_26-8-11.png
    SP500_PnF_26-8-11.png
    18.4 KB · Views: 173
  • SharpChartv05-11.png
    SharpChartv05-11.png
    29.6 KB · Views: 179
Last edited:
It looks like the Libyans could be pumping oil soon. The financial crisis may be sort of solved in the short term, by printing Bonds.

So up for me 1211
 
Back
Top