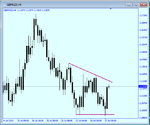
Wedges and trendline breaks

Got stopped out on GBPUSD. I'm long eurjpy though from 113.40 stop at 113.00. Could easily get stopped out in these choppy markets. Looking for about 114.50 at least.

Unlucky mate with the cable trade, i am trying to get something banked these days and leaving the rest to run

eur/jpy going well but it seems to be finding it difficult as well and i would be quick to get out if i see a reversal sign


closing rest of eur/jpy for 20 as that last hour bar is a reversal sign little pin
 
Last edited:
shorting cable here pin bar on the 1 hour chart itno the longterm 50% retrace so looking for some reaction here

aud5.gif


stop above the pin bar


well i have had enough of that rollar coaster

i am out for +25

been a good day and off for a drink now in chimes here in singapore, weather is nice and hot even in the eveings
 
Last edited:
Here is five charts to consider

EURGBP daily
UISDJPY daily
EURNZD Daily
CHFJPY Daily
GBPNZD 240 minute
 

Attachments

  • daveM - SNAG-00043.png
    daveM - SNAG-00043.png
    12.2 KB · Views: 123
  • daveM - SNAG-00042.png
    daveM - SNAG-00042.png
    15.9 KB · Views: 122
  • daveM - SNAG-00041.png
    daveM - SNAG-00041.png
    14.8 KB · Views: 117
  • daveM - SNAG-00040.png
    daveM - SNAG-00040.png
    14.2 KB · Views: 134
  • daveM - SNAG-00045.png
    daveM - SNAG-00045.png
    15.3 KB · Views: 125
Last edited:
Here is five charts to consider

EURGBP daily
UISDJPY daily
EURNZD Daily
CHFJPY Daily
GBPNZD 240 minute

I think you have gone a little crazy drawing lines. Only look at the obvious setups. Not all these look great. You don't have to have two trends lines. Treat horizontal trend lines as stronger forms of resistence and support. I think the best set up is two horizontal then 1 horizontal line. Everyone can look at a chart differently. GBPNZD looks like a good set up. Blaiserboy keep posting though mate.
 
Last edited:
short on a brake off the low of the pin bar aud/usd pin into support at the 72 fib area

bit late with the call but there is a similar entry but not as good in my eyes on the nzd/usd

i dont like the large previous pin on my chart

aud5.gif

this could go along way

stop is already at breakeven
 
Here is five charts to consider

EURGBP daily
UISDJPY daily
EURNZD Daily
CHFJPY Daily
GBPNZD 240 minute


thanks for the charts BB you went a bit mad with your lines haha happens to us all

the one that sticks out to me the most is the usd/jpy, reason being is its coming up into prior support so support becoming resitence

also if you measure the previous swing its at the 61.8% level so we could get a reaction at this level


just my thoughts nothing done on them, i dont see any sign of a reversal yet
 
Got this little idea going. Checking out the two hour on EURJPY, and i can see bearish divergence on EURJPY. I dont know how valid it is, but i'm hoping to see a retracement in EURJPY, and then look for a short.
 

Attachments

  • EURJPYbearishdiv.jpg
    EURJPYbearishdiv.jpg
    112.6 KB · Views: 135
  • eurjpybeardiv.jpg
    eurjpybeardiv.jpg
    110.4 KB · Views: 132
Last edited:
thanks for the charts BB you went a bit mad with your lines haha happens to us all

the one that sticks out to me the most is the usd/jpy, reason being is its coming up into prior support so support becoming resitence

also if you measure the previous swing its at the 61.8% level so we could get a reaction at this level


just my thoughts nothing done on them, i dont see any sign of a reversal yet

Yes USDJPY has been treating me nicely today.
 
hi lads, how is the trading going, did any of those trades work out BB, Brettus?

been unable to look at the markets due to work so not sure were prices are even at,

my aud/usd trade got stopped out for nothing shame as it was up 90 pisps at one stage but i could not manage the trade over work commitments

anyway wont be back in london till monday so looking for a good week then

have a good weekend
 
Using the wedges and channels has been quite a shift for me as I had been depending on indicators...... a radical change indeed........ lol

I haven't been wanting to clutter the thread with the charts. but I have been doing really well with the 'two line' charts in a trending market.

I have not had much luck with the ranging patterns so I stay away.
 
not sure if anyone looks at wti?

but here is my chart, its getting to a nice interesting area either looking to go long if we get a break and a pullback or looking fr sign of a reversal

james 2.gif


the other chart that interest me at the moment is eur/usd and i am looking to get short around these levels, near support becoming resitence and 38% retrace of prior longterm move down, already moved but there could be a 2nd chance to get short with very little risk

aud5.gif


the best trade of last week was the usd/jpy with BB flagged up and it turned nicely

aud4.gif

it turned nicely a great example of support becoming resitence and confluence of some fibs
now i am looking to get long this as it could turn in these areas again
 
not sure if anyone looks at wti?

but here is my chart, its getting to a nice interesting area either looking to go long if we get a break and a pullback or looking fr sign of a reversal

View attachment 88358


the other chart that interest me at the moment is eur/usd and i am looking to get short around these levels, near support becoming resitence and 38% retrace of prior longterm move down, already moved but there could be a 2nd chance to get short with very little risk

View attachment 88360


the best trade of last week was the usd/jpy with BB flagged up and it turned nicely

View attachment 88362

it turned nicely a great example of support becoming resitence and confluence of some fibs
now i am looking to get long this as it could turn in these areas again

I like the EURUSD trade. USDJPY has to be bid these levels. There will be intervention if it finds its way back down to 85, but it really depends how long term you are. I think USDJPY and EURUSD have gotta be the charts to look at over the next week. GBPUSD still looks bid now. I hear alot of about stops to sell EURGBP back down to 0.8220 aswell, so maybe thats the trade.
 
as for cable i will be looking to short the 158 level, support becoming resitence and 61.8% level so major area if it gets up there

[/ATTACH]

eur/gbp could be played if we break support and we get a pull back and a continuation pattern

looks like a nice trade if it happens
 

Attachments

  • aud4.gif
    aud4.gif
    32.8 KB · Views: 156
just want to show how you could have got a nice entry off the 4hour chart on usd/jpy

the trade was was flagged up libve by BB if you look back at his chart

now a pin bar formed at the top of the trend line and you could have sold below the low of this with stop above pin 35 point risk and you could have expected to take profit at the test of the lows bout 150 points so nice Risk reward

aud5.gif

now the pin bar at the bottom would have me considering a long but would like to see more reasons from my daily chat
 
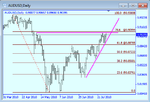
AUDUSD daily

I am not too sure how you would draw this.... however, it is interesting because there is a double top and a significant fib line, those together indicate to me that there will be a sizable move south soon

Maybe I am barking up the wrong tree...........?
 

Attachments

  • daveM - SNAG-00000.png
    daveM - SNAG-00000.png
    16.6 KB · Views: 148
AUDUSD daily

I am not too sure how you would draw this.... however, it is interesting because there is a double top and a significant fib line, those together indicate to me that there will be a sizable move south soon

Maybe I am barking up the wrong tree...........?

I think AUDUSD is an extremely good short. I think i noticed some bearish divergence on AUDUSD aswell. I've heard good word on the street that it's a short, but it's hardly trustworthy, but AUD has had a good run against usd, gbp and eur recently.
 
as for cable i will be looking to short the 158 level, support becoming resitence and 61.8% level so major area if it gets up there

[/ATTACH]

eur/gbp could be played if we break support and we get a pull back and a continuation pattern

looks like a nice trade if it happens

I like the GBPUSD trade 1.5820. GBPUSD does like 20's and 80's as i think someone mentioned in another thread. I'm gonna go ahead and put in an order at this level, with a close stop. If we see a pin bar i will add to the short. Fibonacci level which i dont normally believe means much but on these levels and time frames, usually means many are looking at it and gives it greater validity.

Check out IG's autochartist. Makes searching for patterns easy. Actually it just does everything. Brilliant software.
 
Last edited:
NZDUSD 240 minute

This may well break through that line
 

Attachments

  • daveM - SNAG-00001.png
    daveM - SNAG-00001.png
    12.9 KB · Views: 153
just off the plane from singapore back home in london, not sure if i should be looking at charts as i never make good decisions when i am tired

cable is near the levels i want to short, i could just take a short here or wait for a confirmation (best to wait for a conformation)

bit like the aud/usd no confirmation of a revrsal at that double top so would have kept you out of the trade as it moves up

eur/gbp broken down so wating t see if there is a pull back for an entry

usd/jpy has already moved up so leaving that one

wti moving down from these levesl as i thoguht it might really looking for a pin bar to get me into this
 
Back
Top