You are using an out of date browser. It may not display this or other websites correctly.
You should upgrade or use an alternative browser.
You should upgrade or use an alternative browser.
Wallstreet1928 Analysis & live calls on FTSE,DAX,S&P...aimed to help New traders
- Thread starter wallstreet1928
- Start date
- Watchers 252
- Status
- Not open for further replies.
cheers Tom.
I are just posting my trades here, If you are following me stops 10pts away or if USA futures breach the lows first.
Only in this for a few points, I wouls hate for others to follow what i post here and come un stuck 🙁
This is a good risk reward trade as we could get a good start in USA and see a fruitfull position.
Unfortunatly I can not do this as going out laters .....
dr.blix
Senior member
- Messages
- 2,279
- Likes
- 33
Morning all,
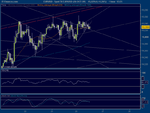
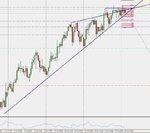
Any opinions on E$? What was a rising wedge, now looks like an ascending triangle - I fancy the long side to 1.5090 ish area, and maybe higher.
hey geo,
i've been watching E$. i still see 970 as more likely than 090. i could see it going up and spitting out 060 before a drop though...but then, i'm always wrong.
i've been nursing a E$ short from 031 (because i didn't have the patience to wait until 060 :whistling)
dr.blix
Senior member
- Messages
- 2,279
- Likes
- 33
SuddenDeath
Legendary member
- Messages
- 14,063
- Likes
- 143
anyone here use prospreads, ? got an email from them, direct access futures
Geofract
Experienced member
- Messages
- 1,483
- Likes
- 112
hey geo,
i've been watching E$. i still see 970 as more likely than 090. i could see it going up and spitting out 060 before a drop though...but then, i'm always wrong.
i've been nursing a E$ short from 031 (because i didn't have the patience to wait until 060 :whistling)
Hey Dr.B - thanks for the comments.
This is how I see it, for what it's worth... On the H4 chart I see the rising wedge, which now looks like an ascending triangle. Also, lots of buying during the asian session. In theory I would be long now from 1.5022, but not sure I should take it... doubt is a killer! lol
Why do you think 970 is more likely?
Good luck with the short Squire. Nice artwork btw 🙂 I can't short, as it's goes against the strategy, but there is a 21 just passed on the daily I think?
Attachments
Geofract
Experienced member
- Messages
- 1,483
- Likes
- 112
...looks a bit messy, as the main trend lines only make sense when panned out.
EDIT: in fact it looks like a right bloody mess! 😆
Damn, are those candles I see there Dr.B? 🙂
dr.blix
Senior member
- Messages
- 2,279
- Likes
- 33
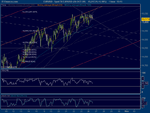
this is how i have it geo.
essentially i see a basic battle right now between a short term down channel and a longer term up channel.
i suppose i'm using indicators to help tell me which one to favour...but, as i'd mentioned previously, i could have a 200 pip drop and STILL be in an up trend.
the dotted lines are my up-channel levels (the red being the very bottom of this up-channel).
the broken lines are for the recent mid-term down-channel.
bearish osc div just points to a drop, but, there's always data/news/oil to fire things back up again i suppose...but this is where my ignorance comes in.
EDIT: i should say 980 for support, not 970...
Attachments
Last edited:
Da.DesiTrader
Well-known member
- Messages
- 472
- Likes
- 3
FYI for those who might be interested in attending.
http://www.trade2win.com/boards/t2w...4-london-city-canarywharf-traders-social.html
http://www.trade2win.com/boards/t2w...4-london-city-canarywharf-traders-social.html
dr.blix
Senior member
- Messages
- 2,279
- Likes
- 33
Damn, are those candles I see there Dr.B? 🙂
they are indeed my little currency speculating 'tradigner' friend. :cheesy:
i use candles on one chart and bars on another...i still find it easier to spot reversals on bar charts.
Geofract
Experienced member
- Messages
- 1,483
- Likes
- 112
bugger, support is holding...maybe you'll get the 090 geo!
that would be the top of my orange line (which is not the top of my up channel, but a very key channel line)
Well lets see.. it's a bit of a battle right now.
Btw, have you tried trading $JPY Dr. B, apparently it is the most technical FX pair. E$ is not the easiest trade, imho.
Hello to Kaisen btw!
- Status
- Not open for further replies.
Similar threads
- Replies
- 72
- Views
- 19K
- Replies
- 21
- Views
- 7K


