You are using an out of date browser. It may not display this or other websites correctly.
You should upgrade or use an alternative browser.
You should upgrade or use an alternative browser.
Wallstreet1928 Analysis & live calls on FTSE,DAX,S&P...aimed to help New traders
- Thread starter wallstreet1928
- Start date
- Watchers 252
- Status
- Not open for further replies.
or down to 9000 after the meeting?
9,000 is what I prefer to see but DOW has been pushing the 9844 level a few times this week. This could break today
Da.DesiTrader
Well-known member
- Messages
- 472
- Likes
- 3
Don't do it 🙂
It is true that when price breaks a previous swing high or low there is an initial added momentum as orders are triggered on the break of that level. If you had direct market access, were able to catch ticks from the move, had the speed and technology, fine, but working with a spread this is not a good idea.
That aside, IMHO you should just never have any risk reward ratio less than 2:1. What you are talking about is 1:2. 5 pips sounds like a quick catch (I don't know if you factored in the spread) but with a 10pip s/l after 5 losses in a row you now need 10 wins to just break even. Over the long term this is not a good idea. If you think probability is on your side, that's not enough - it can probably work each time but possibly also not work for a long while. The only thing that sees you through that stretch is having paid for your losers by having a rule to set a minimum win as more than your maximum failure on any given trade.
Why not take that idea and expand it to a higher timeframe. You can see that a previous high or low being broken means fresh interest at that level and orders coming in to push price further. Look on higher TFs and work out a strategy that can capitalise on that with a better risk/reward.
Good idea on longer TF's for instance weekly/bi-weekly or monthly highs. The problem with that is to workout stop losses. I have tried to reduce stop loss from 15 to 10 and it failed a few times. Maybe a multiplier in proportion (ie, 15x4 for monthly high and target 20 pips)? But, then it would still remain 3:1 risk reward.
I also kept spreads into account. So I am looking in total for a move of 12 pips above the previous high (3 pips my trigger, 4 pips spread and 5 pips target).
Any suggestions on that front?
Cheers
Da.DesiTrader
Well-known member
- Messages
- 472
- Likes
- 3
Anyone catch that cable spike ?
I placed a trade on it through ZTL method. Would've worked well, but I closed it at b/e while commuting. Didn't know the BoE minutes were coming out, and I try not to trade around major news. Would've been a nice or a bad one to catch.
Anyone catch that cable spike ?
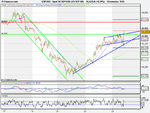
I got a decent fill for once with IG - 16360.
My target was the 61.8% retrace from the previous fall, which is also the current res area @ 16403. I had a feeling we may make R1 @ 16433 which it touched on the nose and is falling back from. So +43 pips.
I am now looking to see what short entries this offers now on the crosses - I am favouring GBPCHF.
Chelski
Well-known member
- Messages
- 487
- Likes
- 5
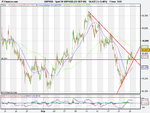
Very difficult to catch those un less you are straddled or lucky, i have seen too many set off only to go the other way.
That said here is the 1h and 15m chart, had you of felt brave!!
Nice upward support.
That said here is the 1h and 15m chart, had you of felt brave!!
Nice upward support.
Attachments
Good idea on longer TF's for instance weekly/bi-weekly or monthly highs. The problem with that is to workout stop losses. I have tried to reduce stop loss from 15 to 10 and it failed a few times. Maybe a multiplier in proportion (ie, 15x4 for monthly high and target 20 pips)? But, then it would still remain 3:1 risk reward.
I also kept spreads into account. So I am looking in total for a move of 12 pips above the previous high (3 pips my trigger, 4 pips spread and 5 pips target).
Any suggestions on that front?
Cheers
Those numbers are terrible mate. Your profit target is only just one pip more that your spread and 2 pips more than your trigger. In % terms you've given up 75% of the total trade expectation to your trigger and spread. You should be aiming to give up less than 15% ideally, imho.
I think you need to think of a profit target in line with the time frame you are trading and as a % of the daily range of that pair. Look at Forex Market Hours to see when the sessions open and look at your charts on different time frames to see when the moves happen and what patterns they take. Think how if a previous low or high is broken and that provides an opportunity, what are the other factors surrounding it?
I'll give you an example of something I backtested (briefly!) last night, but have not traded.
EURCAD is a messy pair. It moves in fits and starts, a bummer to trade but when certain levels are broken and conditions are in place it provides really strong moves. Put on your pivot points for all periods and look at 2H. Now you could say to yourself, the rule is to trade on a break of previous days high/low on the third 2H bar (6am bar) when
1) price is moving in direction of the pivot bias, ie. above pivot then in a long direction 2) the three preceding bars - 12midnight to present - have all remained above/below pivot
3) I am above/below the 24/72/200 whatever Moving Average
This in just itself would have given you confidence that a break of a high was in line with a larger trend and also takes into account price beforehand and a range for the target above.
This is just a rough example, but add conditions and experiment and keep it simple, but you need to give yourself every chance of a trade succeeding and expect that when it does, it can pay for the other times it doesn't.
As for the above - what I am going to call the Pivot Accelerator Method and Analysis (PACMAN for short 😛) - its more to do with using pivot points on multiple timeframes with illiquid pairs, but I hope you get the idea. Don't box yourself into just thinking 'break of a high' - study price in the conditions when this happens, and work back from there.
OK, I don't write for ages and then give a rambling opus....hope it helps...
Very difficult to catch those un less you are straddled or lucky, i have seen too many set off only to go the other way.
That said here is the 1h and 15m chart, had you of felt brave!!
Nice upward support.
Chelski.
Brave or foolish? 🙂 I hardly never trade cable for that reason, but I think the BoE minutes,as they need to be interpreted, are a a little different than numbers released- ie. what is said, not hard data? No algos programmed out there to start blasting, some human interpretation needed so the moves tend not to be as volatile as you described above maybe.
Patiently waiting for an entry into longer term gbp weakness now.
SuddenDeath
Legendary member
- Messages
- 14,063
- Likes
- 143
Ashraf Laidi on CNBC
Chelski
Well-known member
- Messages
- 487
- Likes
- 5
Chelski.
Brave or foolish? 🙂 I hardly never trade cable for that reason, but I think the BoE minutes,as they need to be interpreted, are a a little different than numbers released- ie. what is said, not hard data? No algos programmed out there to start blasting, some human interpretation needed so the moves tend not to be as volatile as you described above maybe.
Patiently waiting for an entry into longer term gbp weakness now.
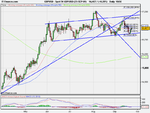
I just saw your earlier comment on fib, were you referring to the down move from 11-21 Sept? I have the same set up on my daily.
Attachments
Da.DesiTrader
Well-known member
- Messages
- 472
- Likes
- 3
Double top on FTSE intraday 15M chart? Break of 5154?
wallstreet1928
Legendary member
- Messages
- 6,609
- Likes
- 89
Anyone catch that cable spike ?
Wi ay man ............Cable is very strong of late but I am now contemplating shorting it before FOMC
double top on BP and BLT ...........intraday 10 min
lower low on MKS ......
BARC.................always going to be weak .........keep shorting this chap
causing FTSE to falter
Da.DesiTrader
Well-known member
- Messages
- 472
- Likes
- 3
Thanks LL. Gives me more crazy ideas to think about. Meanwhile, my morning crossiant and coffee, thanks to the Japanese and Americans 🙂
I am running a short on the DAX from 5745 from 9 am . The thinking behind this was it had reached R1 and was struggling to stay above it. It was also near the intra day highs and again was reluctant to go above. On a RSI/Stochastic levels these were a sell on the 5m TF as well.I set my sl above recent highs. It is now on the Pivot of 5718 and I think will go lower from here. I have moved my SL to BE, and am targetting 5700, then 5684. I also suspect the DOW will be nervous ahead of Bernakes comments, as if comentators are right and there are some indications that liquidity might be pulled from the market in the near future, this will send financials a lot lower. A lot of the recent run up in assets has been fuelled by this very loose monetary policy.
Da.DesiTrader
Well-known member
- Messages
- 472
- Likes
- 3
pentlow, your system seems to be working. Double weakness count at R and then MACD/RSI/Stos pointing downwards from oversold. Stop above recent highs. Its simple enough I guess. I like it already.
pentlow, your system seems to be working. Double weakness count at R and then MACD/RSI/Stos pointing downwards from oversold. Stop above recent highs. Its simple enough I guess. I like it already.
Im a simple man...if I try and look at too many things it makes my head hurt.
I just saw your earlier comment on fib, were you referring to the down move from 11-21 Sept? I have the same set up on my daily.
Just got back...wow...we went higher, as always I exited too early.
Chelski, no I was referring to the swing high of 17th before this move down.
I have the levels of the fibs on the daily put in, but generally I plot the fibs for a retrace from a thrust move (which i qualify as moves down with no trending on the 4H - the move from swing high on 11th was trending downward). Those levels are my targets for a thrust move back up.
I see we are that 50% fib level now, as well as a necktie of 50 and 200MA, as well as R1. I believe the fundamentals point to us to be going downward, and on daily we have completed the right shoulder of the H&S now.
I will be looking to go short on this basis, however any move upward will put the 61.8% level (coincides with weekly pivot and just above daily R2) as the level to look for a bias change downward and the next level to short.
Just want to see this upward momentum finish and downward trend to resume before opening any position - cable has burnt me toooooooooo many times. Also looking at other crosses, CHF and JPY.
What are your plans here?
Nasdiq
Member
- Messages
- 55
- Likes
- 2
Im a simple man...if I try and look at too many things it makes my head hurt.
hehe......
I find simplicity the best way, and most effective...... [so far]
Chelski
Well-known member
- Messages
- 487
- Likes
- 5
Just got back...wow...we went higher, as always I exited too early.
Chelski, no I was referring to the swing high of 17th before this move down.
I have the levels of the fibs on the daily put in, but generally I plot the fibs for a retrace from a thrust move (which i qualify as moves down with no trending on the 4H - the move from swing high on 11th was trending downward). Those levels are my targets for a thrust move back up.
I see we are that 50% fib level now, as well as a necktie of 50 and 200MA, as well as R1. I believe the fundamentals point to us to be going downward, and on daily we have completed the right shoulder of the H&S now.
I will be looking to go short on this basis, however any move upward will put the 61.8% level (coincides with weekly pivot and just above daily R2) as the level to look for a bias change downward and the next level to short.
Just want to see this upward momentum finish and downward trend to resume before opening any position - cable has burnt me toooooooooo many times. Also looking at other crosses, CHF and JPY.
What are your plans here?[/QUOTE
Interestingly these are similar levels!
- Status
- Not open for further replies.
Similar threads
- Replies
- 72
- Views
- 19K
- Replies
- 21
- Views
- 7K