Wallstreet1928 Analysis & live calls on FTSE,DAX,S&P...aimed to help New traders

Status
Not open for further replies.
DAX 4000 solid as a rock....................................

Nostradamus or should I say Wallstreetadamus

I know forecast/predict according to my TA that 4000 on the DAX will get smashed today

get your tomatoes ready to throw at me if I am wrong..........

I am going to short on the dax 4050 ............

stop loss will be 4150 ............reason because I don't want to get whipsawed on the jobs data !!!

I expect to make 100 points on this trade hence 100 point stop loss

I have to go to friday prayers now as well

ok everything going to plan

I have now amended my position to break even and will watch it fall whist i work
 
ok everything going to plan

I have now amended my position to break even and will watch it fall whist i work

the result above is why I have tried several times to swing trade and failed every time

my position was in profit of 30 points at one time and then ended up break even

i am going back to what i do best and that is scalping

I am short DAX again 4065 ...stop loss 4095

target scalp just to get my own back ...haha!!

OK thats more like it.............

market coming back to reality
 
Bit of a slow market today,,, only managed +34 so far, looking for another 10-15 or so to call it a day.. but then again that never happens.
 
the result above is why I have tried several times to swing trade and failed every time

my position was in profit of 30 points at one time and then ended up break even

i am going back to what i do best and that is scalping

I am short DAX again 4065 ...stop loss 4095

target scalp just to get my own back ...haha!!

OK i give up

break even again


I'm calling it quits

take care and have a good weekend everyone
 
Bit of a slow market today,,, only managed +34 so far, looking for another 10-15 or so to call it a day.. but then again that never happens.

just call it a day

S&P stuck on 780

you have made 34 and that is very good

enjoy your weekened
 
Exterminate, Exterminate, Exterminate

All Indices Exterminate

several indices have broken out of their channel and are looking bearish to me, they will attempt there best to trade back into the channel and thats when i will be opening up a short position

I'm not sure what to do with my barclays stock as it will open down but then attempt a move back up as markets will attempt to trade back into the channel and then short again

I will see what happens in the next few minutes

I am in the short camp for today but I think we could get a bounce on DAX as people desperately attempt o push it above 4000 .........and then i will short after the bounce !!

I know, I know i shoudn't be trading but this is going to be one powerful move southwards........and i will leave position open for the long term

looks like it happened

Oh well

I'm off to my friends house in prestwich

good bye all
 
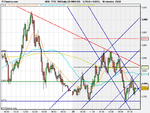
FTSE weekened analysis

1 yr daily chart

well well..... what do we have here then?

a channel within a channel .....Interesting!!

DAX 4000 level is important for me - it holds the key to any further upside

red trend lines - is over all channel or trend

green trend line - is intermediate channel and i will be playing that next week

20 MA is being held at present but it is looking like very weak support as 10 min chart shows further weakness

50 MA will be resistance on the upside


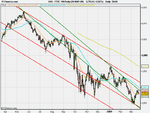
2 day , 10 mins

no real discernible trend/pattern

3770 support level to watch

red sloping trendline needs to be broken to get any real upside in this market


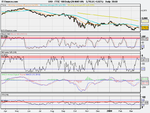
And finally those that pay attention to indicators, I am interested in the stochastic here showing an overbought signal along with RSI and Williams %R..........

not a big fan of indicators but i do pay attention to them now and again
 

Attachments

  • weekend.png
    weekend.png
    25.1 KB · Views: 139
  • 2day 10 min.png
    2day 10 min.png
    26.5 KB · Views: 148
  • indicators .png
    indicators .png
    23.2 KB · Views: 115
Last edited:
wallstreet
price action is much easier to see on this chart.basically,price is pausing at the trendline
eod data.each box is 30 points.1 box reversal.hilo plot
3780 area is a strong support area on this chart
so as you said...no trend just bouncing around.so long as the support holds then we are bullish.3740 makes this chart bearish
 

Attachments

  • FTSE 100.gif
    FTSE 100.gif
    44.6 KB · Views: 125
agree with you on the dax.so long as 4000 holds ,then the chart is bullish.if we get a print of 3950 intraday,then the chart is bearish
 

Attachments

  • DEX.gif
    DEX.gif
    42.6 KB · Views: 133
wallstreet.i have highlighted the chart with the area of resistance.it seems the market is taking every opportunity to sell off when it goes above 3850 area.you can see quite clearly the trendless lateral movement of price.seems it needs a strong event to break higher
 

Attachments

  • ukx.gif
    ukx.gif
    52.6 KB · Views: 150
wallstreet.i have highlighted the chart with the area of resistance.it seems the market is taking every opportunity to sell off when it goes above 3850 area.you can see quite clearly the trendless lateral movement of price.seems it needs a strong event to break higher

interesting ..............

thanks for your analysis my friend !!

so how are you anyway?
 
a slightly lower box size.
30 point box size by 1 reversal /wyckoff method of construction
hilo data plot
ok,so the trend is up.you can see the support at 3750 area.a break below 3750,ie a print below 3700 sets the chart up for a shakeout trade.bulls get squeezed when they see a support has broken.according to earl blumenthal,a p/f technician,this is actually a good point to initiate longs.you can allow up to 3/4 box tolerance.this can retest the trendline.
if this market is well behaved,a nice swing trade can be initiated,possibly below the 3750 support
just some of my thoughts
 

Attachments

  • 100.jpeg.jpg
    100.jpeg.jpg
    148.2 KB · Views: 128
Status
Not open for further replies.
Top