Wallstreet1928 Analysis & live calls on FTSE,DAX,S&P...aimed to help New traders

Status
Not open for further replies.
i notice the inthemoney.com guys talk about the '' Stress Test'' a lot.

What is this exactly?

I think basically banks balance sheets/cash flow have been tested to see if they can withstand a worsening recession - i.e. do they have enough cash to stay afloat if the recession deepens. Initially they all passed, but then it was suggested that a couple may have failed - the results have not been made public yet, and apparently will be delayed till sometime later this week (possibly 7th May).

Those banks who failed are likely to see there stocks dive, unless they can assure the market they're able to raise capital from outside investors, or that the Fed/US Government will bail them out.

That's my basic understanding anyway - anybody else care to add/correct any of the above, feel free.

U.S. Bank Stress Test Results Delayed as Conclusions Debated - Bloomberg.com
 
Last edited:
i notice the inthemoney.com guys talk about the '' Stress Test'' a lot.

What is this exactly?

basically you walk up behind a trader who has just lost his/her shirt/blouse and you loudly announce youve just made fackloads today and throw it in his/her face further by puffing cigar smoke into his/her bleary eyes, saying everyone to the beluga bar on me.

you get a stop watch and time how long it takes for them to either jump out of the window/punch you in the snoz and storm off.
HAHA nice... ill try that sometime...
 
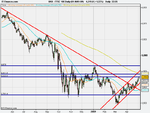
FTSE analysis

trading plan for Tuesday 5th May

1 year daily - up trend looks intact all the way up to 200 MA, but the argument for a pull back is stronger especially with oil @ a peak of $54.5


1 month 1 hr -

1 week 10 min

bias on the short side

I will ............

short if < 4330

long if > 4330
 

Attachments

  • 1 yr daily .png
    1 yr daily .png
    21.3 KB · Views: 137
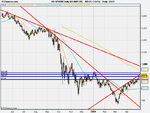
S&P analysis

1 yr daily -

i am short S&P 906 ............stop loss 909

good night
 

Attachments

  • 1 yr daily .png
    1 yr daily .png
    21.1 KB · Views: 127
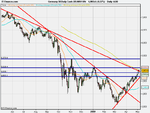
1 yr , daily chart

DAX approaching some resistance

200 MA @ 4950.............can it burst through 5000 today?
 

Attachments

  • dax .png
    dax .png
    21.6 KB · Views: 108
i held shorts in us indices overnite. took profit this morning, FTSE is an interesting one right now. i dont think there is much interest until a more attractive pullback comes in.
 
it looks like everybody is looking for divergences or technical signals to signal that markets have topped
 
there is a vertical count of 4470 on the chart just posted.it just gives you an idea of how far the trend could go.uneless,there are signals of trend reversal,shorts can only be put in on overbought criteria or bad news
 
Morning Gents

Some interesting comments on the ITM blog InTheMoneyStocks - Rant and Rave Blog about light volume, and yet the market continuing to float higher - they're very suspicious... well I guess everyone is waiting for this market to fall on it's a**e.

I like the 2nd piece, which refers to the rally in the great depression. Look further down the page to yesterday for comments on light volume too, and TA vid.
 
s500.there is a vertical count of 936 on this chart.so it could go another 4% higher
 

Attachments

  • 936.bull.jpg
    936.bull.jpg
    163.9 KB · Views: 107
Status
Not open for further replies.
Back
Top