You are using an out of date browser. It may not display this or other websites correctly.
You should upgrade or use an alternative browser.
You should upgrade or use an alternative browser.
Wallstreet1928 Analysis & live calls on FTSE,DAX,S&P...aimed to help New traders
- Thread starter wallstreet1928
- Start date
- Watchers 252
- Status
- Not open for further replies.
very nice reza! i only dabble in the ftse meself!!
thanks guys! Catch you on here tmrw!
Dentalfloss
Legendary member
- Messages
- 63,404
- Likes
- 3,726
wallstreet...where are you
you have been very quiet recently
you have been very quiet recently
Dentalfloss
Legendary member
- Messages
- 63,404
- Likes
- 3,726
geithne keeps lifting up the market
wallstreet1928
Legendary member
- Messages
- 6,609
- Likes
- 89
GEITHNER SPEECH......................
put on bloomberg and keep an eye on what this chap has to say
told you chaps ..........
Mr Geithner = go long on the market ..................
News broke out that 16 of the 19 major banks had failed stress test ....hence market crash yesterday!! (but even i didn't anticipate 35 point drop on S&P)
Then the Administration came out and said it was a rumour and confirmed it wasn't true, but would you beleive this Administration............as an investor you just have to sell!!
then Mr Geithner comes out and makes it official............BANG!! the market flies northwards.........
I do apologise for my inactivity(but I have been quiet active today ....in my humble defense!! haha)
I just can't post as much now due to work, I am falling behind on my day job.
I am off work today and tomorrow and i will try my best, but its summer and i just can't sit indoors for too long!!
I have just come back from gym, trip to decathalon for cricket equipment and then I went to cricket practise
wallstreet1928
Legendary member
- Messages
- 6,609
- Likes
- 89
dawntrader1
Member
- Messages
- 65
- Likes
- 0
anyone got any clues on budget day trading? historics and chartists views would be great to consider.
Dentalfloss
Legendary member
- Messages
- 63,404
- Likes
- 3,726
tips for budget day
tax on beer goi ng up to £6 a pint
tax on wine to £15 a bottle
a tax on all winning trades....50 % of the win
£5 tax on head and shoulders trades
£10 on bullish wedges
£15 on an ma cross
£20 on a divergence set up
however...ftse has wound itself into a tighter coil.note from the chart that triangle has coiled even further.however,this is to no avail as the s&p 500 is giving opposite signals and is now currently range bound after an upside triple top failure
Attachments
Dentalfloss
Legendary member
- Messages
- 63,404
- Likes
- 3,726
Dentalfloss
Legendary member
- Messages
- 63,404
- Likes
- 3,726
Dentalfloss
Legendary member
- Messages
- 63,404
- Likes
- 3,726
dawntrader1
Member
- Messages
- 65
- Likes
- 0
dentist007 ........great info!! thanks
wallstreet1928
Legendary member
- Messages
- 6,609
- Likes
- 89
dentist007 ........great info!! thanks
yes we are very grateful to Dentist for the time he spends in sharing his analysis
thank you on behalf of every one on this thread
wallstreet1928
Legendary member
- Messages
- 6,609
- Likes
- 89
OK so what's on the Agenda for tomorrow
US data - only crude inventories
US earnings - Morgan Stanley will be the big fish .............!! along with Ebay & Apple, but I'm only going to pay attention to wells fargo and Morgan stanley as financials are swinging this market!!
InTheMoneyStocks - Economic and Earning Alerts
US data - only crude inventories
US earnings - Morgan Stanley will be the big fish .............!! along with Ebay & Apple, but I'm only going to pay attention to wells fargo and Morgan stanley as financials are swinging this market!!
InTheMoneyStocks - Economic and Earning Alerts
dr.blix
Senior member
- Messages
- 2,279
- Likes
- 33
yes we are very grateful to Dentist for the time he spends in sharing his analysis
thank you on behalf of every one on this thread
here here...
rock on with your bad self dentist.
thanks for sharing your knowledge 🙂
edit:
in fact, thank you everyone who contributes here (WS, dentist, francis etc)...this is a great thread with people being friendly, open and supportive. hopefully some knowledge will eventually permeate my wooden noggin...good work chaps.
Last edited:
dr.blix
Senior member
- Messages
- 2,279
- Likes
- 33
however...ftse has wound itself into a tighter coil.note from the chart that triangle has coiled even further.however,this is to no avail as the s&p 500 is giving opposite signals and is now currently range bound after an upside triple top failure
yeah i noticed that triangle dentist, i thought it would hold until closing but it broke upwards before it's 5th elliot wave rebound.
wallstreet1928
Legendary member
- Messages
- 6,609
- Likes
- 89
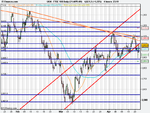
FTSE analysis and strategy for Wednesday 22nd April
3 month 4 hr chart
break out of the channel - red trend lines, can we trade back inside it and maintain the leg upwards........or do we fail and fall short!!
Therefore, 4030 will be important tomorrow .........If we trade above that then I will be able to play a long up to 4060 -4090
The previous double top failed and we fell southwards in February, will that happen again?
If we get a triple top I will be a buyer @ 4100'ish ..............
2 orange trend lines are proving to be useful in determining tops so i will pay respect to them in the interim
4060 and 4090 are two levels to watch for potential shorting opportunities!!
If we happen to trade above 4100 then i will certainly go long
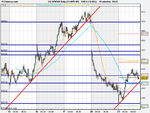
1 week , 10 min analysis
scenario 1 -
scenario 2 -
I will update in the morning ...too tired now
Attachments
dawntrader1
Member
- Messages
- 65
- Likes
- 0
FTSE analysis and strategy for Wednesday 22nd April
3 month 4 hr chart
break out of the channel - red trend lines, can we trade back inside it and maintain the leg upwards........or do we fail and fall short!!
Therefore, 4030 will be important tomorrow .........If we trade above that then I will be able to play a long up to 4060 -4090
The previous double top failed and we fell southwards in February, will that happen again?
If we get a triple top I will be a buyer @ 4100'ish ..............
2 orange trend lines are proving to be useful in determining tops so i will pay respect to them in the interim
4060 and 4090 are two levels to watch for potential shorting opportunities!!
If we happen to trade above 4100 then i will certainly go long
1 week , 10 min analysis
scenario 1 -
scenario 2 -
I will update in the morning ...too tired now
😀 good night friend 😀
SuddenDeath
Legendary member
- Messages
- 14,063
- Likes
- 143
ftse100 today best +9.85 should have minimum upside target of +55pts
Last edited:
- Status
- Not open for further replies.
Similar threads
- Replies
- 72
- Views
- 19K
- Replies
- 21
- Views
- 7K


