Best Thread Vwap Engine

11th June
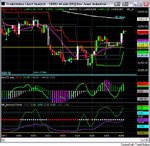
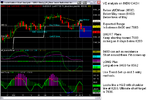
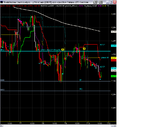
VE has no preference today. Could be a trend breakout in terms of 3-day range but futures cycles are bearish as of now. Look to sell if it breaks below yMean, and look to go long if it breaks above m2 (yesterday's yMean).

Short break out
yMean= ES 934, YM 8682, NQ 1488.

Long break out
m2=ES 937, YM 8708, NQ 1497
 
15th June
I didn't update the journal on last Friday as there wasn't really much to say except that I tried to short the market. Could have been a good one but I didn't want to keep a position overnight/over the weekend.

Today, short NQ with VE signal. Same old set up. It worked many times before and it will work many more in future. No need to guess where I shorted it. ( Discipline point: I covered the position at target level but it wasn't cycle exit. And I missed second signal short for another leg down as I was content with +8.5pts but it could be another +10pts. It showed I was still scared of giving back what I got. Trade with TA not P&L!)
 
16th June
Looking to go short based on INDU CASH bearishness but cycles are not favorable. On the sideline so far.
 
I am very pleased with VE. It is catching major moves. Don't want to blow my own trumpet with charts etc. As a next step, I will be learning how to trade multiple contracts because I want to test if multiple exits is more rewarding than a single entry/exit.

Multiple exit is the way forward?
It means more than increasing the size. Increasing the contract size to two/four/six with one entry/exit is still the same. Here I am planning to enter/exit at multiple points.

In VE methodology, there are two kinds of trades - very short term/limited target trades and swing/multiple target trades. The latter has target profit that is greater than 1R of entry TF, therefore, the dilemma is whether to exit at 1R level ( = amount of risk) or trail profits to reach the next level. That is where multiple exits will be better. Exit half at 1R and trail the rest if TA permits. Not all of them will be runners.

For that, risk level has to be lower than 2. That means adding a second contract with the lowest possible risk thus maximising the RR ratio. Entering two contracts at the same time definitely doubles the risk. So, second entry has to be better than the first one. This is surely a challenge. It involves more work and it is a good thing because it reduces boredom.
 
Last edited:
Thanks to Joey for repping the post above. I also learned from your journal.

I've been doing more research and less trading this week.( well, this sounds like a pro but it's actually wathcing the markets live, taking mental notes and not taking actual trades.. lol..😛 I took only two trades for the week and both were winners- the less you trade the more your win!) Ok, back to the main topic- the reason for doing research was that I felt my stop levels were higher than my pain level and I suffered some drawdowns in May ( also because I missed some good entries and caught up in choppy moves). So, I've been refining my entry methods with a view to identify the absolute minimum stoploss distance.

Absolute minimum stoploss distance (AMSLD)
By that I mean this is the risk I am prepared to place at a particular entry point. I will not risk more than 1 tick from this distance. It actually comes from my personal preference to scalping. VE started as a scalping mechanism and I moved the operating timeframe to 60mins chart to make it easier to spot big move and reduce the number of trades. It did catch big moves and identified trends but the stoploss level (SL) has to be based on 1R of entry time frame ( = 2.5ATR of 10min chart). Roughly speaking, it is equivalent to DOW 50pts, ES 5pts, NQ 10pts.

During April, there was no stoploss exit at all- profitable results. During May, there were about 3-4 full size stoploss exits. The method as a whole was still profitable for the month but I found that I myself was the problem in execution and position sizing. Thats where I found the pain gap. I am not comfortable with SL distance but the system made me use it. The consequence was that I was not careful with the entry point because SL was wide. And, as a result the system made me stay in a trade even though it was turining against the entry. During April, I placed SL as required (full size) but I scratched a trade immediately as soon as I started to feel the pain.

For me, I must place a trade at the best possible entry and would like to see it go straight in my direction or stay inside absolute minimum stoploss distance - it must either prove me wrong or go in my direction. As I always use 'tick' level entry points, there is always a place which identifies absolute minumim stoploss distance. Now, my risk (1R) is equal to absolute minimum stoploss distance, much less than 2.5xATR of ETF.

The result is that I am now very choosy with entry even if there is VE set up is in place thus reducing the number of trades.

Seeding a trade
Thats how I like to call my method of entry because this entry can grow into a fully fledged trend. Stoploss distance with YM 9 points can produce a 50points move. I have confidence in my method that 80% of the time, it goes 1R ( = AMSLD) and beyond hence the need for multiple exits. I know it is very crucial stage for me to make it right for VE methodolgy.

To sum up, I have
- defined vwap as 'the' level to play with, be it today's vwap or prior days (Feb)
- moved to higher TF hourly and above to identify decent moves (March)
- defined 3 tactical set ups (March-April)
- broadened target levels and identify trend trades based on dailies (May)
- tightened stoploss level with AMSLD

Next, I will learn how to
- use position sizing for multiple exits
- pick the best instrument to trade and focus on it ( out of YM,ES,NQ); and

win consistently.
 
15th June

I am getting more confident with my analysis of the markets and also becoming more patient with set-ups and entry. Today, my assessment said there could be a big UP move even when CNBC was saying markets were disappointed with jobs figures etc. Therefore, I duly made my effort to go long NQ as it was the strongest one. It didn't pull back to where I wanted, I was saying like c'mon come back to 1454/1457 etc because that's where I wanted to go long with 100% confidence. Finally, I had to go long around 1462 area, with only 70% confidence level thus I reduced the target profit as well. It went up to where I wanted but I was out at my limit exit area. Anyway, it is good to be up for the day so far.👍
 

Attachments

  • 090625 NQ long.jpg
    090625 NQ long.jpg
    98.9 KB · Views: 193
Last edited:
Greenspan's take on this rally

Below is the excerpt of Alan Greenspan article, taken from FT article.
FT.com / Comment / Opinion - Inflation ? the real threat to sustained recovery

Stock prices, to be sure, are affected by the usual economic gyrations. But, as I noted in March, a significant driver of stock prices is the innate human propensity to swing between euphoria and fear, which, while heavily influenced by economic events, has a life of its own. In my experience, such episodes are often not mere forecasts of future business activity, but major causes of it.

This is where TA and PA has a role in trading. He is one of the top economists in the world and yet he acknowledges the human nature which drives the market beyond the fundamentals.
 
26th June, Pre Market analysis

Indices are at MD mean at the moment hence it shows lack of direction.

Daily: NQ set to fly - time line within 3-5 days, DJ not ready yet.
Vix: based on Vix, INDU Cash should retest 8600 or above.
Conclusion: up bias towards end of the month.

Currently Hourly cycles are exhausted. A little bit of pullback is required for a nice up move.

So, roughly speaking INDU Cash pullback to 8400 area and then another greenshoot towards 8600 is what I'd like to see.
 
So, roughly speaking INDU Cash pullback to 8400 area and then another greenshoot towards 8600 is what I'd like to see.

VE's forecast was right on spot! 8550 seems like a resistance level to watch. Went long NQ in stead of YM. Happy so far🙂
 

Attachments

  • 090629 INDU CASH 60 cycle.jpg
    090629 INDU CASH 60 cycle.jpg
    105.8 KB · Views: 177
Reason why I can't automate VE

This chart is part of bigger 60minute Reversal set up. Higher TF (EntryTF) was already OB-. So look to sell with this TF.

Usually, it should be taken at OB and/or meanlines. Here, cycles became weaker and weaker. H1, H2 and third time testing H1 level where MACCI is no where near OB level.

At that time, smallest timeframe (T100) was OB- and already weak.

In this situation, waiting for OB condition at this TF is just a waste of time.

Just calculate risk/return and take 'reversal short' at T100 OB- when it broke down below vwap.

Risk = 3pts ( stop at 1441) entry at 1438

Target level = 1432 ( low of overnight) for +6pts or 1421.75 (low of yesterday) for +16.

So RR is 6:3 = 2:1, or 16:3 = 5:1

Yes, it went down as low as 1421 ( from 1438, so +17pts, 68 ticks move).

p.s there is an alternative TA term for this cycle pattern (see the filename for a clue) 😉
 

Attachments

  • 090707 NQ cycles Head and shoulder.PNG
    090707 NQ cycles Head and shoulder.PNG
    78.4 KB · Views: 220
Leo

OB on an oscillator doesn't necessarily mean the market has to turn down any time soon - certainly not in a trending market. MACCi is no different from the other oscillators in that respect.

When I was looking at various cycles (on the $INDU), I noticed that when the market was trending, certain time frames would go OB but other lower ones would still oscillate. Perhaps it's a combination of behaviours that indicate trending markets. Herein lies the magic of getting a damn computer to tell you if the market is trending or ranging.

Tricky stuff indeed.

Cheers

Pete
 
Plan for July

It's simple. Stay short if it's below

i) 8200
ii) 8400

for targets of

i) 7980
ii)7600

Long above 8400, targeting 8590.

Wish all of you a good profitable month!!!!!
 

Attachments

  • 090707 INDU Cash plan for July 09.PNG
    090707 INDU Cash plan for July 09.PNG
    64.8 KB · Views: 216
Leo

I know you haven't got to this point yet - but if you are having the system enter trades based on your oscillators in multiple time frames, at some point you will discover that there is a flaw in multi-time frame processing. This is not an issue if you are watching the cycle indicators in real time, it is an issue if you are placing orders based on last value vs current value of a higher timeframe indicator.

Option 1 -
One chart with multiple time frames on it, such as 60, 30, 10, 5,3,1 etc. - this will give you late signals on the higher timeframes. An hour late on a turn on the 60.

Option 2 -
One minute timeframe only, but generating synthetic bars for the higher timeframes based on the 1 min bars.

Only option 2 will give you a timely response to changes in your 60 min timeframe, it's a flaw known by a few of the more nerdy TS developers.

If you want me to send you that code, I can let you have it gratis if you do not disclose it the methods or resell your indicator package. I have synthetic MACCi & Synthetic FSST. I had a look at synthetic Inverse Fisher but decided to bang my head up a wall instead. If you see how synthetics work in practise, you will be able to apply it to other indicators.

If you are not attempting to automate entries via strategy code, then this is a non-issue.

Cheers

Pete
 
8th July

Cycles, that of vix in particular, indicate a bounce today. Bounce or not, VE does not recommend a long in this set up. So, plan for today is to stand aside if it moves up and yes, to keep shorting the market at tactical entry points.
 
It's simple. Stay short if it's below

i) 8200
ii) 8400

for targets of

i) 7980
ii)7600

Long above 8400, targeting 8590.

Wish all of you a good profitable month!!!!!

Just to update where it is in the context of the plan. Price levels for YM are about 50pips lower than indu cash. Hence short level was 8150.

As long as it stays below 8098, TP1 and TP2 could be reached. (TP1 should be 8059, not 8049 as on chart)
 

Attachments

  • 090710 YM plan.PNG
    090710 YM plan.PNG
    56 KB · Views: 168
Last edited:
13 July

Well, last week's sell campaign had some legs but it didn't reach multi targets. By the end of the week, daily cycles were over sold. NQ is trying to break out today if it is successful, then YM and ES may follow. I am still bearish until INDU breaks out of 8400. Actually, a brief rally may be good. I might even go long later. It is low risk set up for a long ( R= 60pips or less)
 
Last edited:
Looks like my crystal ball is not returing definite answers this time. My framework would work well if it re-test 8400 and eventually break below 8300. It is supposed to stay below 8600 so I would use intraday set up should it stays above 8600.

In summary,

Short campaign resumes

* below 8300, below 8400 depending on future set-up


Range or channel trading between

*8400 and 8700.

NQ is about to re-test June highs, so need to analyse in a few days time.
 

Attachments

  • 090716 INDU Cash analysis for rest of July 09.PNG
    090716 INDU Cash analysis for rest of July 09.PNG
    82.6 KB · Views: 194
From tormorrow onwards, I will post daily plan if I can. I have written some codings so that I don't need manual calculation for targets etc.
 
Back
Top