TWI
Senior member
- Messages
- 2,562
- Likes
- 269
I just read this thread and so decided to experiment a little on e-mini.
I have not played around much with the values, but just added an MA moderator to make general differentiation between bull and bear market and moved RSI o/b and o/s bands 20% either side of 50 depending if bullish or bearish.
Use 5 day RSI
Moderate with 21 day simple MA
When price below MA use 30 & 50 RSI levels for buy/sell
When price above MA use 50 & 70 RSI levels for buy/sell
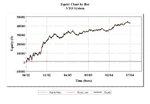
The equity curve is impressively smooth (attached) but this is little deceptive as time period is long so disguises fact that for e.g. there is a 6k draw at one point in 2003.
However saying that average winner at ~4.9k is more than twice that of average loser and out of 75 trades 50 are profitable.
Would take some ballsy discipline at times but may just be workable.


