Value Trading versus Momentum Trading

Could someone be kind enough to explain how exactly you use volume as part of a trading strategy. I currently daytrade with MACD and Stochs.

I have read many posts of experienced traders who have dropped all indicators and trade on price/volume alone. However, looking back through various charts I have seen that high volume does not necessarily result in significant price moves and that low volumes can create large moves....and vice versa.

Admittedly, these charts aren't differentiating between sell volume and buy volume, is this the key? Also, what levels of increased volume (in general) would indicate that the corresponding price action will be sustained and constitutes a lower risk entry.

And lastly, for daytrading, what form of streaming data is recommended to indicate sell/buy volume (stocks not indices). Many thanks.
 
ersatz99

here's a thought - if you have seen price moves on low and high volume - and those participants moving the price are doing it anyway - and doing it to make money and big money at that -maybe just price is key to everything

i do use volume - but you can just trade on price and in fact it might be best to get an understanding of price before you look at anything else

a chart might look great with MACDs and Stochs and Fibs and Trendlines and etc etc - but an understanding of just price wll put you above 99.99% of learners
 
Back now,

Stevet

Quote " WWAP is a lagging moving average of price as far as i can see "

VWAP is not a lagging moving average of price..

Moving averages reduce noise by averging out the price over an arbitray time frame hence all Traditional MA are time frame dependent .. VWAP isnot ..

This is why VWAP is the bench markt for institutional traders and not MA or any kind of MA cross overs..

How ever if you wish to call it Moving average then I have no problems with that ........

PS:- I have seen VWAP to be incorrectly used as Moving average but this is totally misleading .. As long as time frame is part of the smoothing equation then it can be classed as MA otherwise not..
 
Last edited:
Grey1

ok, do you agree that WWAP is a lagging indicator?

and that although you trade divergence from WWAP - it could well be that rather than the stock returning to WWAP - the stock could diverge further from WWAP and then WWAP could move to the stock in order to consolidate the WWAP value?

institutional trading is a wide term and often misunderstood - did you work as an institutional trader and use WWAP then so that you know exactly what they do and you know where their trading parameters kick in and effectivly know the weight of their money is forcing your trade to where you want it to be?
 
Last edited:
grey1 . I think you'll find that the VWAP is used predominantly by US based funds, who lack the expertise of execution to take the trading risk themselves, and thus aim for a VWAP benchmark. In addition various funds can only ( due to trustee's requirements) execute business at the VWAP - normally through a program trade.
 
stevet,

the stock could diverge further from WWAP and then WWAP could move to the stock in order to consolidate the WWAP value?

Highly unlikely, just check some charts and you will see that it is extremely rare that vwap moves back towards the stock if the price has drifted from it. Bear in mind that we are talking of stocks that trade more than 1 million shares a day. If the price drifts from its VWAP then the amount of volume that would be needed to cause the VWAP to move to that price level would in itself cause the price to move back towards its VWAP or cause it to drift even further away. There may be some convergence but not as much as you may expect.


Paul
 
Last edited:
City

I know all that,,


Stevt,

VWAP is simply an average price it is not a lagging one either.. If I tell you 1+ 2= 3 and its average is 1.5 then I have set a bench mark called Mean or average for two numbers,, That is all

When you say it lags just explain what does it lag relative to .. ?


Quote “ and that although you trade divergence from WWAP - it could well be that rather than the stock returning to WWAP - the stock could diverge further from WWAP and then WWAP could move to the stock in order to consolidate the WWAP value?

This is totally wrong my friend.. VWAP ( mean ) carries volume .. VWAP ( mean ) is heavy weight gorilla.. IF VWAP FALLS say 50C for the sake of argument then price has probably already fallen 400C,, VWAP CAN NOT MOVE TO PRICE. IT IS THE PRICE WHICH MOVES TO VWAP.. ( Look at the VWAP as an elephant and the price as a Fly... LOL )

May I suggest you to read about mean reversion please? It is an elemantry statistical concept..
 
Grey1

do you have the formula for WWAP

judging by the graph you posted - WWAP is not quite the elephant you seem to think it is - it moved a lot intra-day

and a mean is a mean - nothing more - and a changing mean is bad news - regardless of what it is based on

and reverting to "mean" in a mathematical sense and its utilisation always has to take into account a changing "mean"

what have you found to be the maximum deviation from WWAP and was it percentage based or somthing else?

i hope for sure that my comments are not coming across as negative about WWAP - the opposite is true - as i am only interested in real life experience of methodologies and not theoretical and you have been doing this and profitiing from it - and that is all i need to hear to get me interested

but i do like to get to the meat of anything as i hate losing money on sure fire winners for the sake of a little bit more investigation

all my stuff has to be capable of full computer automation - so i need to get all the parameters together - especially as i would seek to use derivatives in most cases for trading
 
I think I know what Stevet is trying to say.......not trying to answer for him as I am sure he will do that himself ...& if I have misunderstood then he will say.

VWAP is not a lagging indicator when compared to say an MA but it is still derived from the price & volume...so price, volume & market sentiment r still driving the whole thing.

also for a market to move away from its VWAP.......it has to move away! creating a trade opportunity in itself........then u r looking for a trade back to the VWAP but would not take this if the price action did not indicate this potential, But then the market could become range bound at a new level.....creating a new average p/paid, contract traded etc.

so I guess what I am saying is VWAP is quite a useful tool/guide used in conjunction with the price action....but price action is still king & the ability to read this would mean VWAP is not essential

Jay
 
But then the market could become range bound at a new level.....creating a new average p/paid, contract traded etc.

This is true of all differential or spread trading strategies. Every so often, the range will shift so it's a good idea to try and trade with the trend, so to speak, to hopefully minimise the damage.
 
Grey1 said:
This is totally wrong my friend.. VWAP ( mean ) carries volume .. VWAP ( mean ) is heavy weight gorilla.. IF VWAP FALLS say 50C for the sake of argument then price has probably already fallen 400C,, VWAP CAN NOT MOVE TO PRICE. IT IS THE PRICE WHICH MOVES TO VWAP.. ( Look at the VWAP as an elephant and the price as a Fly... LOL )

Grey1,

I know I should really go back and check all your trades to give myself an indication, but... does that mean that you VWAP reversion trades only come later on in the day?

Thinking logically about it I expect the middle of the day is probably the ideal time?

Near the open, not enough volume in the VWAP already so there is likely to be more movement in it. End of the day VWAP would be stable but not necessarily enough time for the price to revert if it diverges.

wysi
 
Finlayson

thx

i think what you said is right - or at least right in what i was getting at, but a bit sleepy due to excess beer last night - so not completly sure?

but i think you did highlight a particular specific possibilty

and i just have a feeling that WWAP is an attempt to do what traders do all the time - which is analyse key price specific areas - but has tried to used a best fit mathematical model to do it

and for all that - it maybe the only way to do it - as i am programing what i can see on a chart in seconds into a computer automated system - and at least with regard to picking up specific price areas, it is just so much easier to do it visually!
 
stevet,

Here is a link to a definition of VWAP and the basic formula for how it is calculated that I gave on another post:

http://www.trade2win.co.uk/boards/showthread.php?s=&postid=54579#post54579

If you want the forumla I can give you a Tradestation formula that does it if you have TS that is ?

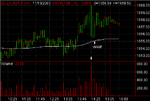
Attached is a chart of the ES where I have highlighted a volume spike and you can see that the volume from this point forward was higher than previously. The VWAP moved but by a small amount only which I am hoping to demonstrate shows that to move VWAP a long way takes a huge amount of volume at the newly traded price. I picked a future just to show that it is not just stocks that VWAP could be useful on.


Paul
 

Attachments

  • es 13th nov.png
    es 13th nov.png
    7.4 KB · Views: 200
Stevet

Quote " do you have the formula for WWAP ? "

I do but donot you think it is only fair for you to do a tiny bit of research yourself .. You have been posting few threads without knowing what VWAP formula was ? ( Not having a go honest )

I however would be pleased to tell you the formula if you could not find it ..

Quote " judging by the graph you posted - WWAP is not quite the elephant you seem to think it is - it moved a lot intra-day "

The drop in VWAP was at OPEN when market gaps up or down .. VWAP moves very very small amount intra day( on MSFT could only be 1C some times ) .. it needs a huge amount of buying/ selling pressure to shift VWAP .. As I said it is that big big elephant...


Quote " but i do like to get to the meat of anything as i hate losing money on sure fire winners for the sake of a little bit more investigation "

lets hope both be the winner in the market..

PS:-- I have already outlined the boundaries for deviation from the VWAP in my previous posts .. statistically when the deviation is around 2SD away then there is 95% chance of reversal . I have mentioned that day traders are far better off to confirm this level with their L2 screen..
 
Nice to see some Fundamentalists using statistical measures to trade the market . it is about time too ..
 

Attachments

  • mean.jpg
    mean.jpg
    106.3 KB · Views: 192
did a search on google for wwap and came up with a lot of stuff about water - and i dont think it meant liquidity

so need the formula for WWAP

but if its a prob, its ok, i will get it from my company when the US opens

anything to do with standard deviation is applicable to all technical indicators - and price tests all technical indicators and tests standard deviations from those technical indicators

and price also precipitates all technical indicators to ensure future standard deviation levels are consistent with past price action
 
stevet,

I think u did have 1 too many last night, maybe your eyes r out of focus.

Its 'Veeee Wap'
 
WYSIWYG

Spot on .However the dump money some times buys into news setting an early bench mark for the rest of the traders.. any deviation from this price should be watched on L2 for reversals.. VWAP strategy controls your RISK levels and this is what i love about this system. As long as we know we should not be trading near the VWAP we are 1 step ahead of the crowd..


Jay,

Quote "VWAP is not a lagging indicator when compared to say an MA but it is still derived from the price & volume...so price, volume & market sentiment r still driving the whole thing. "

Agree.. 110%

Quote ".......it has to move away! creating a trade opportunity in itself........then u r looking for a trade back to the VWAP but would not take this if the price action did not indicate this potential


Agree 110%.. Market is an alive social system and not a 100% statistical and experimental system .. WE MUST confirm our entries on L2..

For example lets stock X has deviated 50C from its mean .. What do I do? do I take a postion if GSCO sitting with 10000 @ 60 C below the mean ? NO of course not..

We play the game hand in hand with the power of maths and other players
 
blash

fuck - you are right!

gonna have another coffee - cant even open my eyes!

lucky i trade US and not Europe
 
Top