Stevet,,
Quote "have you ever compared the results of using WWAP with using other market technical indicators and seeing how they match up with WWAP? "
There are two kind of technical indicators as I am sure you know..
1)
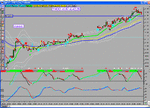
Those which tell you there is a trend but can't tell you if trend will continue.. These are trend following indicators.. Like those posted in madasafish chart
2) Those which tell you there is more chance of reversal than X bar ago..
Both above ignore one simple fact and that is the price bench mark set by mass participants during the trading day ..
I no longer use TA indicators because they dont performed in real time ( they are excellent for POST EVENT ANALYSIS.. HEY LOOK AT THAT MOVING AVERAGE SIGNAL IT TELLS YOU WHEN TO GET IN AND WHEN TO EXIT ..) and this is my honest answer.. I know most people love their RSI . CCI or MA but for me the answer is NO ..
I will quote this from a pro site for your attention ..
Quote " Relative value traders and arbitragers often monitor the Money Flow chart and the VWAP chart closely and simultaneously. Both charts should move in tandem in proportions: higher positive Money Flow should drive the price and the VWAP higher, while stronger negative Money Flow should push the price and the VWAP lower. In case one sees a significant drop in VWAP accompanied by sizable positive Money Flow, one could expect that the price will quickly recover and it is a golden short term buying opportunity. The opposite is also true.
I use VWAP in slightly different manner as to above quote but with the same principle in mind.. There other researcher who use VWAP in other ways ...
http://www.traders.com/Documentation/FEEDbk_docs/Archive/052001/Abstracts_new/Reyna/Reyna.html
Use of VWAP and L2 is very suitable to my style of trading ..


