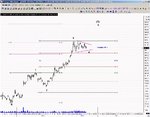
MOLX was in a Strong Downtrend
MOLX was in a “Very Strong Down Trend.” The Market was also in a downtrend from the morning but was in consolidation from about 11:00 ET thru 13:15.. Also, bottom fishing is one thing during an Oscillating market, but when a stock is in a “Strong Trend” as shown in the attached chart, you are trading against the trend!!! Also, the LVII actually has no meaning in today’s markets. It did back about 15 or 10 years ago, but not today. Its value is only good for checking the spread, T&S speed, and mainly for entry.
Look at the 5-min chart & notice that all 3 ( 5, 10 & 20) EMA’s are in a strong downtrend. It would take a lot to change a price trend that this stock was in. Notice the volume at 13:55 on a 1-min (not attached) & 5 min Chart which caused this stock to change directions.
Note, I am only trying to give you constructive criticism.
See attached 5 min Chart on MOLX.
Sorry for the direct approach, but just trying to help another trader.
Nas
Hi BP,BlackPanther said:Since you guys are back, I'm going to join in the fun! Been having a good time today with MOLX. I'm sure a few of you other guys have been too.
It was floating above the whole number of 32, so I decided just as a test to post a bid for 5 lots on EDGX at the whole number.
I pulled it, and within under a second the price had fallen down without any volume! Computer algorithms taking over?
See the screenshot, and observe the time stamps:
1) Placed bid
2) Pulled bid
3) Down goes price
Mmmm, fun 🙂
Note: I wouldn't advise anyone to do this unless they are experienced! Had someone decided to hit all the bids I could have been long 500 in a falling stock if I didn't have a larger short position on.
MOLX was in a “Very Strong Down Trend.” The Market was also in a downtrend from the morning but was in consolidation from about 11:00 ET thru 13:15.. Also, bottom fishing is one thing during an Oscillating market, but when a stock is in a “Strong Trend” as shown in the attached chart, you are trading against the trend!!! Also, the LVII actually has no meaning in today’s markets. It did back about 15 or 10 years ago, but not today. Its value is only good for checking the spread, T&S speed, and mainly for entry.
Look at the 5-min chart & notice that all 3 ( 5, 10 & 20) EMA’s are in a strong downtrend. It would take a lot to change a price trend that this stock was in. Notice the volume at 13:55 on a 1-min (not attached) & 5 min Chart which caused this stock to change directions.
Note, I am only trying to give you constructive criticism.
See attached 5 min Chart on MOLX.
Sorry for the direct approach, but just trying to help another trader.
Nas

