Urban Towers Scalping Strategy

Re: Are you in? NZDUSD June 14

Here is a trade happening live on NZDUSD 15min charts. Are you trading it?

I have launched a chatroom for Urban Towers Scalping Strategy. Contact me to get access to it. If the forum moderators allow me the post the link to get into the chatroom, I'll be glad to post it here.

Skype : navin.prithyani

Navin Prithyani
- urbanforex

Hi

just added your address to my Skype

see u there

It's an honour to chat with a Great Trader like you

THANX
 
Re: Are you in? NZDUSD June 14

Also a PIN bar on this chart as well
 

Attachments

  • pin.jpg
    pin.jpg
    45.7 KB · Views: 616
Navin
I have been trying to follow this strategy you kindly put forward for a couple of weeks. (you've answered a couple of questions for me, in a different Forum)
The trouble I have is that whilst I can trade from work, I cannot run MT4 or any other packages from my office PC, so have to do it from a laptop running on a mobile internet connection. The combination of a small screen and limited download capacity makes it near impossible to watch more than about 4 pairs at once. Could you please lte me know which 4 pairs you consider give the most frequent set ups under this strategy.
I do very much like the strategy by the way, I've managed to catch about 7 or8 trades in last 2 weeks and the only 2 losers are ones where I've bent the rules by trading from a flat or narrow MA channel, so many thanks !!

Kind Regards

Dave

Hi Dave,

Yes, try not to bend the rules. I've already done the research for you, its easier to keep it simple the way it is. Additionally, patience goes hand in hand with your profit. More patience = more profit because you are more relaxed and logical in your trading decisions then.

I have 12 pairs on my screen. Majors, Yen crosses, and AU, NU, USDCAD :smart:

- Navin Prithyani
 
Conference Room Limit

:clap: Last week I got flooded on my skype with requests to get into the conference room for this strategy. So I'm deciding to increase the limit to 100 attendees instead of 20. And yes it was free, it still is free, and it always will be free.

Navin Prithyani
- urbanforex
 
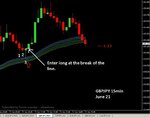
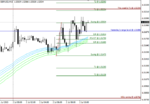
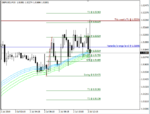
June 21st GBPJPY

Here is a trade from today on GBPJPY 15 min charts.

Navin Prithyani
- urbanforex
 

Attachments

  • Jun. 21_03.jpg
    Jun. 21_03.jpg
    46 KB · Views: 3,975
Hi new tester here :clap:

whether anybody tried to convert this system into EA ? And test on historical data ?
 
Nice UT trade on GU today...hope the annotation is legible.
 

Attachments

  • 23rd June.PNG
    23rd June.PNG
    72.1 KB · Views: 2,794
...didn't take the UT trades on GU earlier. I'm just wondering if this week's fib ext target (5225) will be hit before / during / after NFP :)
 

Attachments

  • 2nd July.PNG
    2nd July.PNG
    28.9 KB · Views: 853
...didn't take the UT trades on GU earlier. I'm just wondering if this week's fib ext target (5225) will be hit before / during / after NFP :)

From memory every one of the charts that has been posted on this thread has had a PIN bar on the MA indicator and every one has worked. Could someone post a chart where price broke through the MAs and didnt turn around?
 
...didn't take the UT trades on GU earlier. I'm just wondering if this week's fib ext target (5225) will be hit before / during / after NFP :)

..wkly 1.382 tgt ext touched with announcement, amazing.
 

Attachments

  • 2nd July after nfp - wks tgt touched.PNG
    2nd July after nfp - wks tgt touched.PNG
    28.2 KB · Views: 422
..yesterday's failure and today's current GBP/USD UT trade. I didn't take yesterday's short, it was 'late' in the session after fib targets for the day had already been met.
 

Attachments

  • 6th July.PNG
    6th July.PNG
    61.5 KB · Views: 373
..yesterday's failure and today's current GBP/USD UT trade. I didn't take yesterday's short, it was 'late' in the session after fib targets for the day had already been met.

Interesting, the one you have marked as failed was not a PIN bar, albeit only by a couple of pips. There was one several hours later a bit higher which worked very well. Can you tell me what this indicator is calculating, obviously its MAs but what combination? I know it is available for free but I'd like to understand more about what it is based on.
 

Attachments

  • tues.jpg
    tues.jpg
    147.9 KB · Views: 273
pboyles, the pin bar you highlight wouldn't have qualified for an Urban Towers short, as the preceeding candles were above the MAs rather than below, but i agree with you and find the best UT signals are usually 'PIN like'.

The EMA (close) settings: 37, 39, 41, 44, 47, 50
 
...textbook UT short on GU earlier this morning, which i missed as still akip.
 

Attachments

  • 7th July.PNG
    7th July.PNG
    33.3 KB · Views: 314
pboyles, the pin bar you highlight wouldn't have qualified for an Urban Towers short, as the preceeding candles were above the MAs rather than below, but i agree with you and find the best UT signals are usually 'PIN like'.

The EMA (close) settings: 37, 39, 41, 44, 47, 50

Thanks, I've just plotted it on my charts, I'll keep an eye on it. Hows it been working for you based on the original rules?
 
urbanstrategy.jpg


Description : During a trend, when the market retraces to the blue MA with at least 3 consecutive lower highs (3 towers),

I assume that was supposed to be 3 higher lows as that's what is represented in the chart.
 
Top