Trading with point and figure

We have to break down through the pink level 18350ish, not much then in the way before 18100.
then comes the Dog as 007 would call it 18k! After that its ...................... lol

DOW

35j03lg.jpg
 
No, looking for it to drop big time, may not be today but a correction is way over due.

I agree it seems like it should have a good sell off but my grey hairs taught me to be wary when the market has had plenty of opportunities to fall and turned them all down.

Dax doesn't want to fall from here, Dow only off 1.3% from recent highs, so not overly bearish there. Quiet markets next couple of weeks could get another push on and then pay the piper in September.

The real action is in the currencies last couple of weeks and in general wouldn't wish to go to bed long or short, just play each day as it comes.

Now watch it crash -)
 
US Q2 Advance GDP - Headline 1.2% much weaker than expected, but details key, plenty of scope for revisions

a) Personal Consumption was very strong, as expected, at 4.2% SAAR pace, and was the engine of growth for Q2 after a sluggish 1.6% in Q1; on the other Final Sales was weaker at 2.4% than thee forecast 3.2%, but still markedly higher than Q1's 1.2%

b) Business Investment was again weak, falling 2.2%, with the Q1 fall revised to -3.4% vs. previous -4.5%; interestingly this was again due to Business Investment in Structures, reported at -7.9%, though the Q1 -7.9%
for this measure is now estimated at +0.1%!

c) Inventories ($-8.1 Bln) deducted a whopping 1.15 ppts from the headline reading, in some senses welcome, particularly given concerns about an inventory overhang, but this is the item that is most subject to revision

d) GDP deflator at 2.2% vs. expected 1.9%, and following Q1's revised 0.5% (prov. 0.4%) also deducted relative to expectations

... and then we come to the section "monthly data for Q2 hinted at precisely the opposite":

e) Trade was apparently a net positive contributor, with Q2 Exports rising 1.4%, while Imports fell 0.4% - no one would have pencilled that in after yesterday's advance Goods Trade Balance

f) Housing Investment fell a whopping 6.1%, which can be rationalized away as a correction to the outsized 7.8% rise in Q1, but again does not really fit with the run of monthly data

g) Govt spending also deducted, falling 0.9%, which was primarily due to fall of 1.3% in State & Local Spending following of strong gains in Q1 and Q4 2015; this has actually been flagged by the weak Construction Spending data in recent months, which have been dragged lower a setback in road / state infrastructure spending

"Take homes": there are rather too many elements (i.e. even more than usual) which are likely to be subject to quite large revisions, though the robust Personal Consumption component does not fall into this category. It is rather difficult for the FOMC to suggest that the deflators are running significantly below target, given the headline PCE Deflator was at 1.9% (Q1 2.2%), and core at 1.7% (Q1 2.1%). But today being month end and following the post BoJ volatility, and with the BoE policy decision next Thursday and the US Labour report due next Friday, it is probably wise not to over-interpret market price action as a reaction to today's report.


..........................................................................

Marc Ostwald
Strategist
ADM Investor Services International
 
We have to break down through the pink level 18350ish, not much then in the way before 18100.
then comes the Dog as 007 would call it 18k! After that its ...................... lol

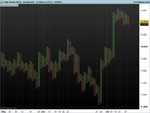
Thought I's try and replicate your chart Moneylender in ProRealTime. It's a 30 minute chart, with a 30 point box with a 4 box reversal applied to the high / low range. This is what I'm getting . . .

Wall Street (DFB).png

I'm using IG's data which is probably different to yours - but not so much so that it's going to show up as much as it does in a long range macro chart like this. Can't think what else might account for it though?
Tim.
 
Thought I's try and replicate your chart Moneylender in ProRealTime. It's a 30 minute chart, with a 30 point box with a 4 box reversal applied to the high / low range. This is what I'm getting . . .


I'm using IG's data which is probably different to yours - but not so much so that it's going to show up as much as it does in a long range macro chart like this. Can't think what else might account for it though?
Tim.

Tim, they are not that dissimilar. I didnt realise Pro did PnF, remind me again what they charge/mth or how many trades you have to do to get them free.
 
spike in oil is caused by profit taking according to Reuters!

Yeah, 8 or 9 down days in a row had to end sooner or later, shorts being covered before end of month, plus dollar weakness is helping oil, EURUSD going bananas also.

I consider myself a pun master, but I only just *got* "oil pumping', I am ashamed of myself... :|
 
Stopped out.

Here we go on the SPX taking out the Rs.

R3 @ 2191
R2 @ 2182
R1 @ 2177
 
I didn't quite catch the bottom, but boy was I close :cool:

wzIpv7m.png


NB: Please note I don't post graphics of my many failed trades :innocent:

*bailed for +75... couldn't take the pressure... oh wait another pun :)
 
Top