Trading with point and figure

a closer look
2 days of data

2u6ogmw.gif
 
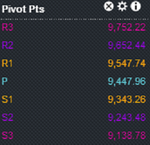
that minor uptrend not quite broken as yet
horizontal supp/aqua at 9400 and 9360 area
horizontal res goes up to 9550 area
could go either way
possibly a bull test first
 
oil/wti
2 days of data
looks like it wants to brek res
index could go with that

2zywzfn.gif

31.00 the dog
 
Not around much today, hosp apt, but here are the pivots
 

Attachments

  • pp.png
    pp.png
    35.4 KB · Views: 115
  • SP.png
    SP.png
    35.7 KB · Views: 128
wti trying to take out res.taking index slightly down with it
lets see what happens
1914 area is trend supp on spx chart just posted
 
Last edited:
thinking if we stay above $30 a barrel..then a decent rally...who knows...lol
Baker-hughes rig count at 6 pm
 
Last edited:
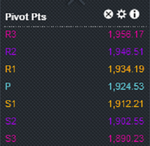
needs to stay above 1900 area /aqua trendline and horizontal supp
breakdown area/purple horizontal at 1914-1917
trend res at 1923 area
should be strong supp 1896-1900..who knows..lol
1904 area first..there now..ish
 
Top