Moneylender
Legendary member
- Messages
- 5,693
- Likes
- 369
Now where though?
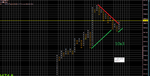
a bad bounce and shorts in for the killscalps in and out of our 1922
1910 on the cards..possibly
1913 first
no guarntees...lol
plummet....lolIts still at 1924!
plummet announced at 3.47pm..plummet started at 4.00pm1910 on the cards..possibly
1913 first
no guarntees...lol
did you eat your plummets today ??Bounce off 1916 which happens to be the pivot as well coming!
bounced againBounce off 1916 which happens to be the pivot as well coming!