Dentalfloss
Legendary member
- Messages
- 63,404
- Likes
- 3,726

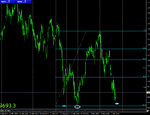
only a p/b to supp/prev breakout
then retest of high
no real sign of a change in trend ..as yet
1 min data over last 24 hours


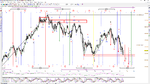
yes..greatShort the spikes is still favorite I think
should be a point soon where we have to spot a change in trend

it has probably reversed off that ...but not printed a 3 box reversalI have a tripple bottom almost on daily @ 9350- 9400
we had that marked on Friday morning as a horizontal supp areadidnt quite make the Tripple bottom but it was close enough I think.
didnt quite make the Tripple bottom but it was close enough I think.
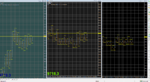
my current p&f Setting
box 8 reversal on 3,2 and 1
wander if the reversal 2 does not clutter the screen
it is not so much about which chart formation is the strongest...imhoit is more about extracting information from the chartStudying the DuPlessis book draws attention to different strengths of 3 and 1 reversals.
On reversal 3 catapults are clearly visible together with poles and flags.
On reversal 1 fulcrums ( consolidation followed by reversal or continuation) are easier to spot.
Reversal 2 is in between 3 and 1, and I am still making my mind how useful the 2 reversal is to me.
I have dedicated computer to P&F, three charts run still ok.